Fig. 12
Download original image
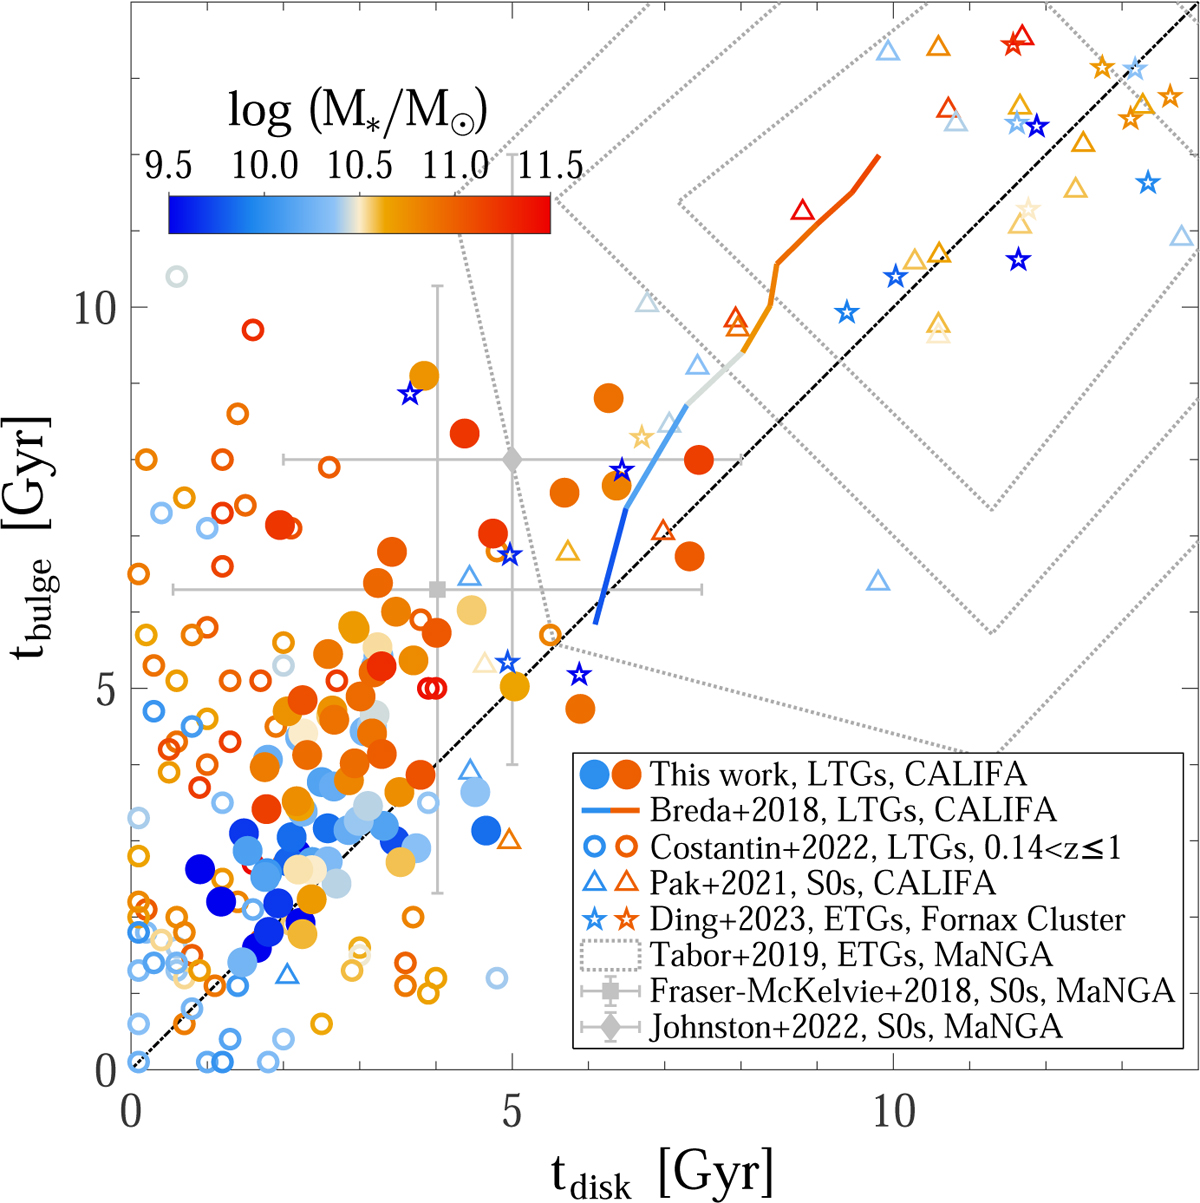
One-to-one comparison of bulge ages tbulge and disk ages tdisk from different works. The dots represent 82 CALIFA spirals in our sample, with the bulge and disk ages corresponding to the ages of the hot and cold components within Re derived from model B (tbulge=thot, tdisk=tcold). The coloured folded line illustrates the variation of mean bulge ages with mean disk ages for 135 CALIFA spiral galaxies from Breda & Papaderos (2018). The circles indicate 91 spiral galaxies at redshift 0.14 < z ≤ 1 from Costantin et al. (2022). The triangles denote 29 CALIFA S0 galaxies (shifted to 2 Gyr younger for both bulges and disks) from Pak et al. (2021). The pentacles denote 18 early-type galaxies in the Fornax Cluster from Ding et al. (2023). The stellar mass of galaxies are indicated by the colour bar. The region covered by the grey dashed lines (shifted to 4 Gyr younger for both bulges and disks) roughly shows the density distributions of 272 MaNGA early-type galaxies from Tabor et al. (2019). The grey squares and diamonds represent the mean bulge ages and disk ages in the samples of 279 MaNGA S0 galaxies (Fraser-McKelvie et al. 2018) and 78 MaNGA S0 galaxies (Johnston et al. 2022), respectively, with the corresponding error bars representing the standard deviations of bulge ages and disk ages.
Current usage metrics show cumulative count of Article Views (full-text article views including HTML views, PDF and ePub downloads, according to the available data) and Abstracts Views on Vision4Press platform.
Data correspond to usage on the plateform after 2015. The current usage metrics is available 48-96 hours after online publication and is updated daily on week days.
Initial download of the metrics may take a while.