Fig. A.1
Download original image
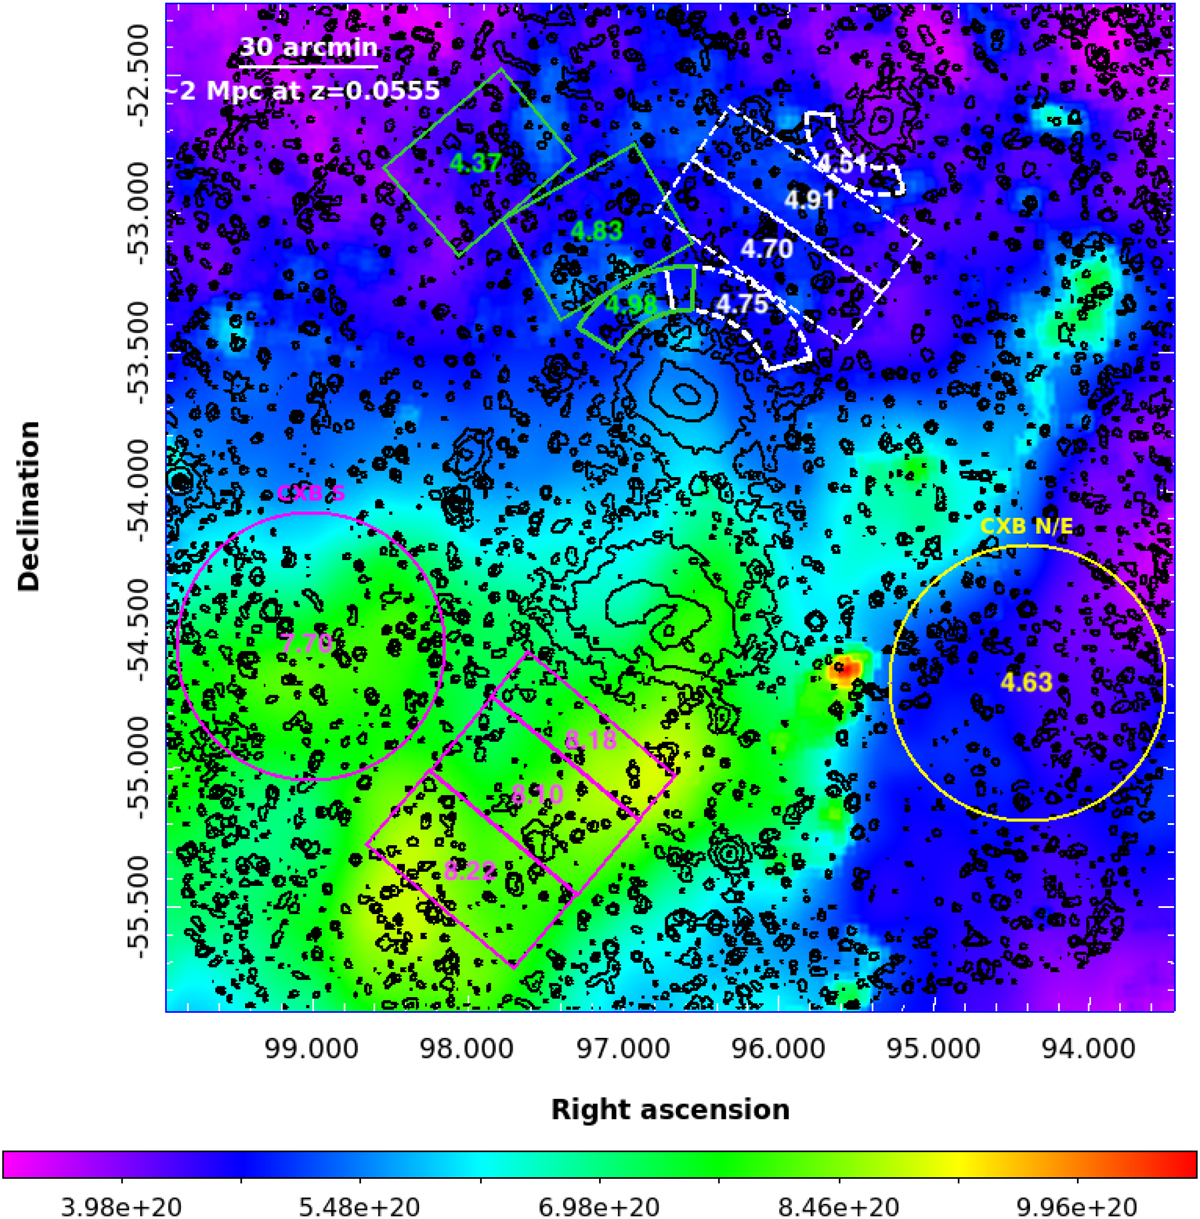
The A3391/95 total NH map generated from IRAS 100 µm and HI4PI. We overlaid the source and CXB regions used for the spectral analysis (boxes, sectors, and circles). The numbers in each region are the average values in the units of 1020 atoms cm−2. The eROSITA contours are plotted in black. The colorbar is in the units of atoms cm−2.
Current usage metrics show cumulative count of Article Views (full-text article views including HTML views, PDF and ePub downloads, according to the available data) and Abstracts Views on Vision4Press platform.
Data correspond to usage on the plateform after 2015. The current usage metrics is available 48-96 hours after online publication and is updated daily on week days.
Initial download of the metrics may take a while.