Fig. 6
Download original image
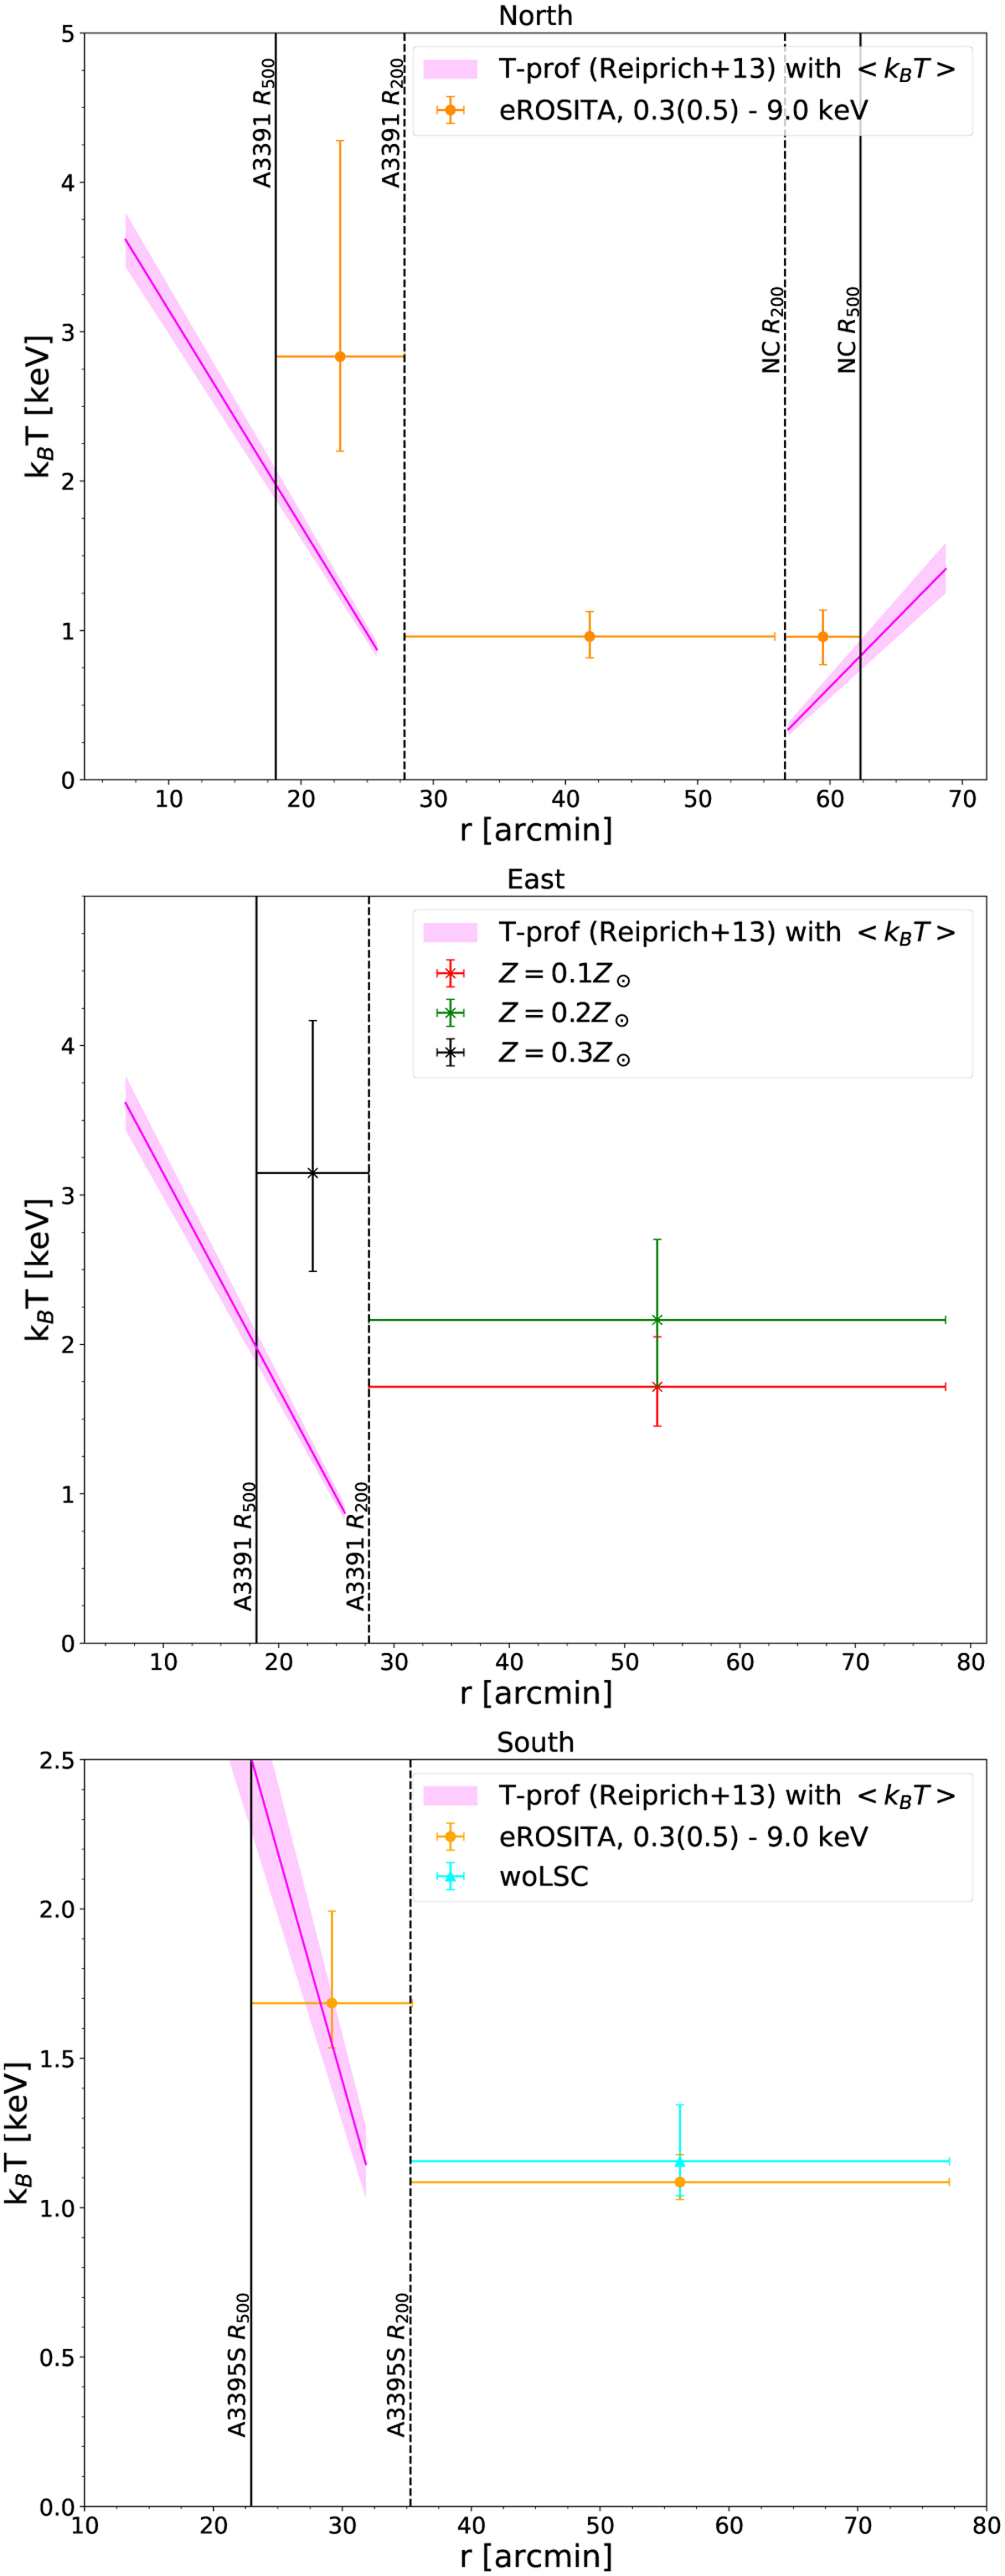
eROSITA temperature profiles of the outskirts and filaments for the northern (top), eastern (middle), and southern (bottom) regions. The pink shaded areas are the 1σ temperature profiles from Reiprich et al. (2013) using ![]() as mean temperature of each cluster (see Table 5). The black vertical solid (dotted) lines mark the R500 (R200) of the parent clusters.
as mean temperature of each cluster (see Table 5). The black vertical solid (dotted) lines mark the R500 (R200) of the parent clusters.
Current usage metrics show cumulative count of Article Views (full-text article views including HTML views, PDF and ePub downloads, according to the available data) and Abstracts Views on Vision4Press platform.
Data correspond to usage on the plateform after 2015. The current usage metrics is available 48-96 hours after online publication and is updated daily on week days.
Initial download of the metrics may take a while.