Fig. 4
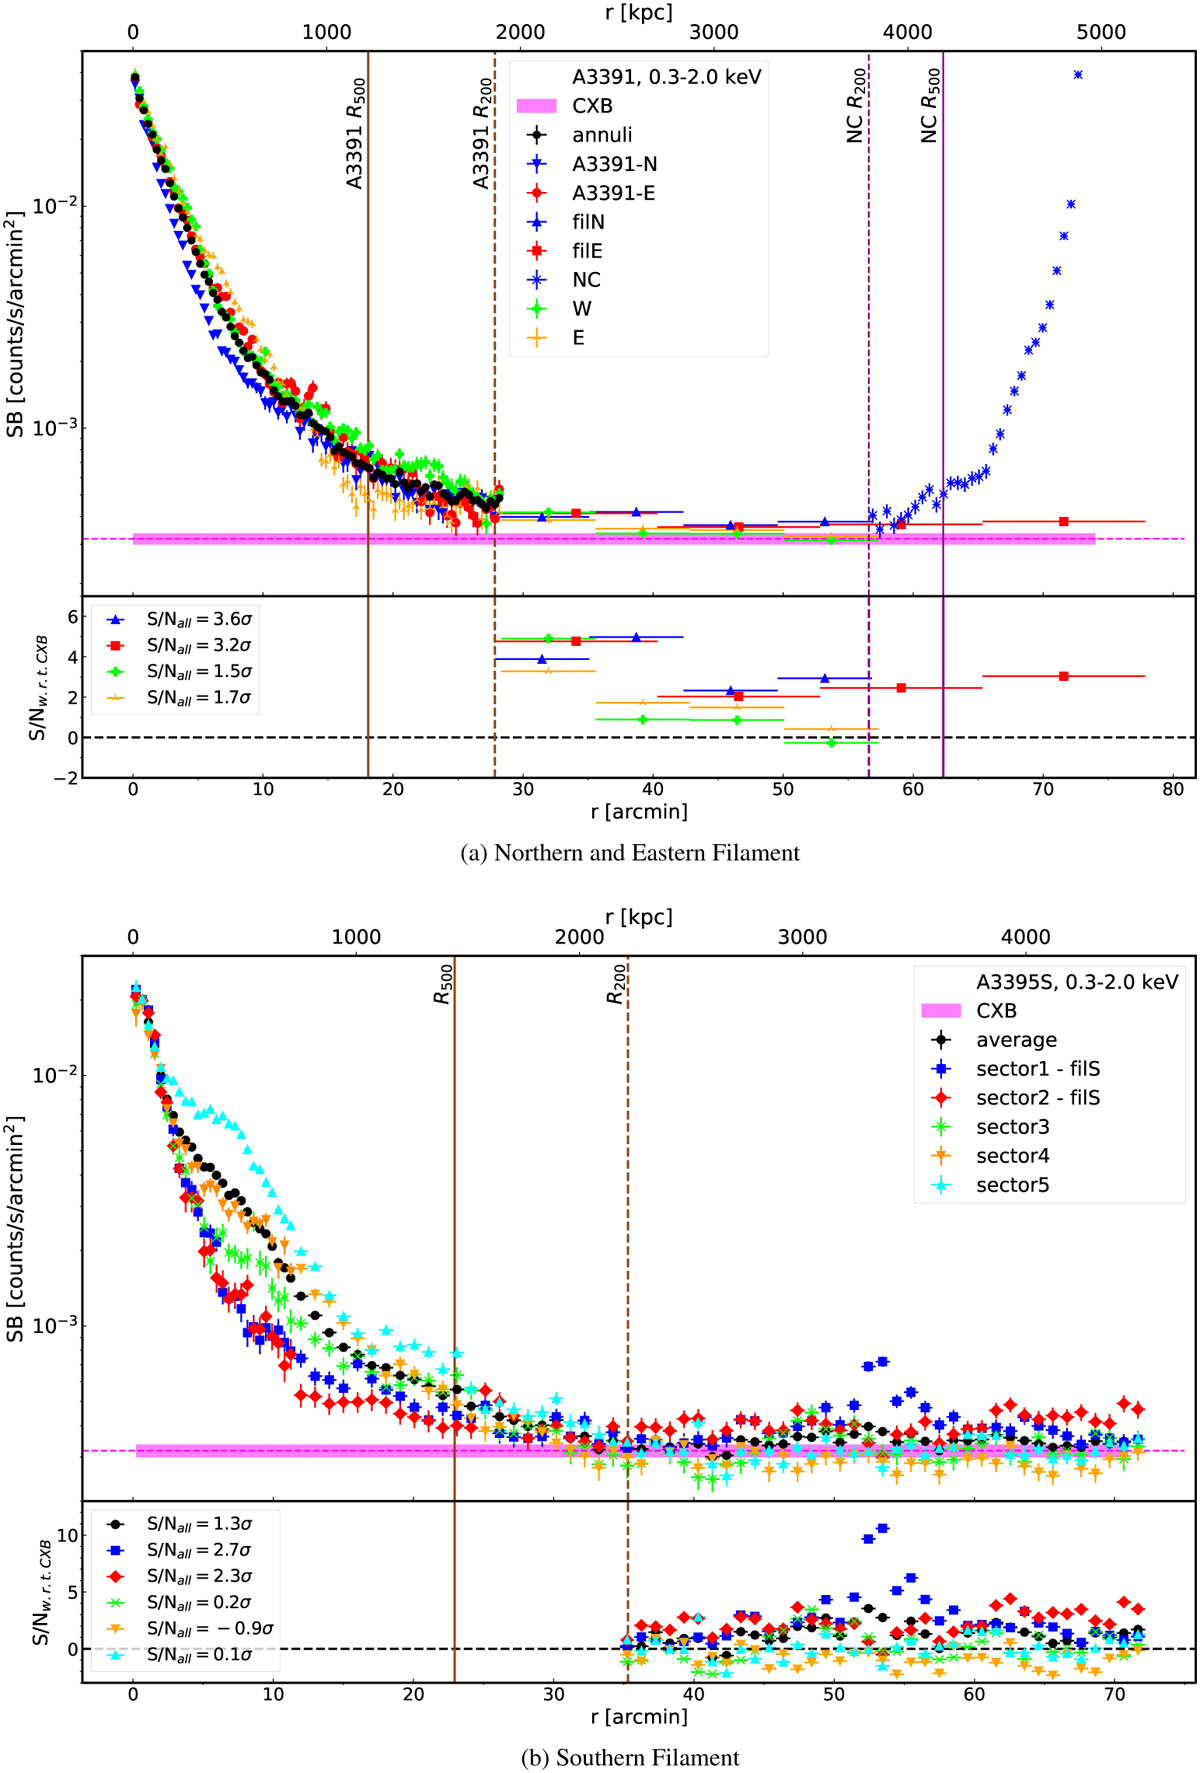
Download original image
PIB-subtracted SB profiles in the 0.3–2.0 keV band (top plots) and the significance values with respect to CXB for r > R200 data points (bottom plots). The overall significance, S/Nall, of the excess emission in this regime is listed in the legends. (a): Profiles from A3391-N, NC, and the Northern Filament in blue; A3391-E and Eastern Filament in red; and west and east of A3391 in green and orange (see Fig. 3, left). (b): Profiles from Sectors 1–5 of A3395S. Sectors 1 (blue) and 2 (red) are related to the Southern Filament (see Fig. 3, right). The CXB level and its 1σ range are plotted as the magenta horizontal dashed-lines and magenta shaded area. The R500 (R200) of each cluster is plotted as vertical solid (dashed) lines.
Current usage metrics show cumulative count of Article Views (full-text article views including HTML views, PDF and ePub downloads, according to the available data) and Abstracts Views on Vision4Press platform.
Data correspond to usage on the plateform after 2015. The current usage metrics is available 48-96 hours after online publication and is updated daily on week days.
Initial download of the metrics may take a while.