Fig. 2
Download original image
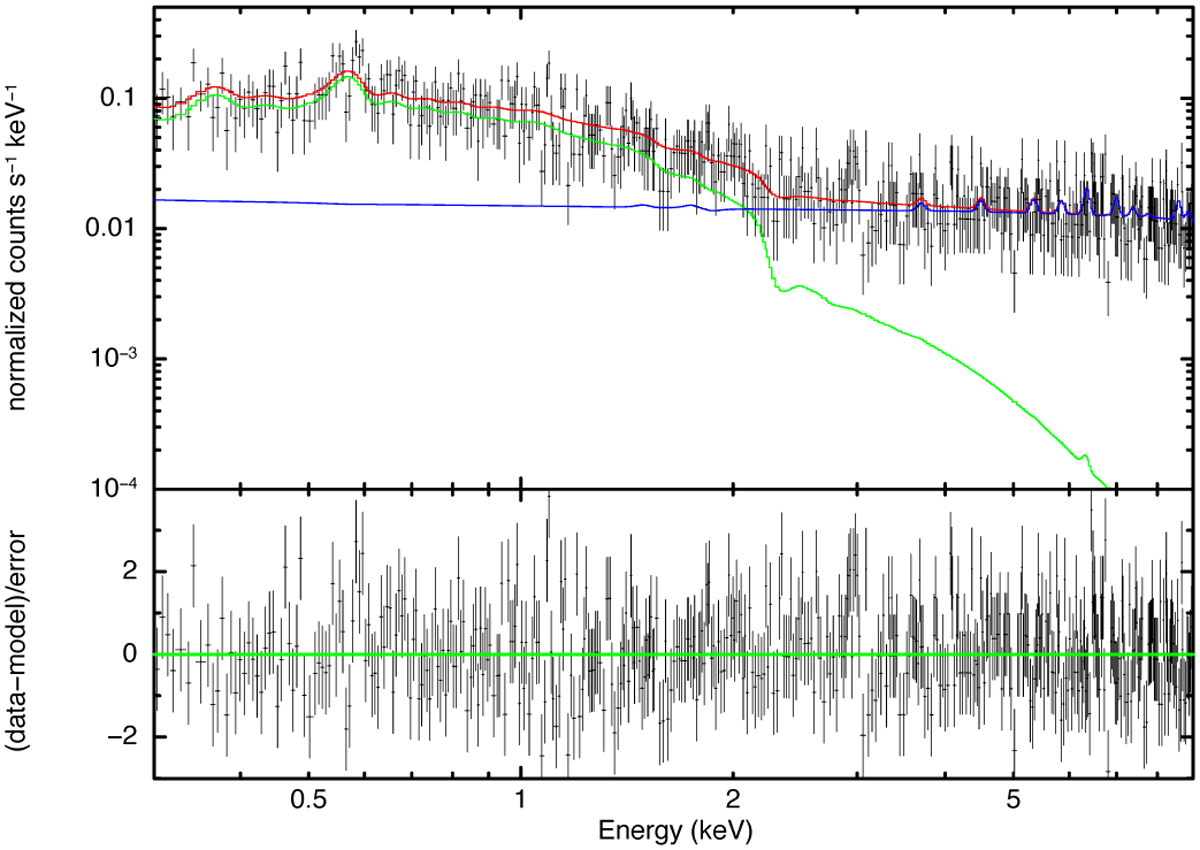
eROSITA spectrum of the northern outskirts sector of A3391 (A3391-N). The spectra and the corresponding response files of TM3 and TM4 are merged for better visualization. The black points are the spectral data, while the red, green, and blue lines represent the total model, the cluster and CXB model, and the instrumental background model, respectively.
Current usage metrics show cumulative count of Article Views (full-text article views including HTML views, PDF and ePub downloads, according to the available data) and Abstracts Views on Vision4Press platform.
Data correspond to usage on the plateform after 2015. The current usage metrics is available 48-96 hours after online publication and is updated daily on week days.
Initial download of the metrics may take a while.