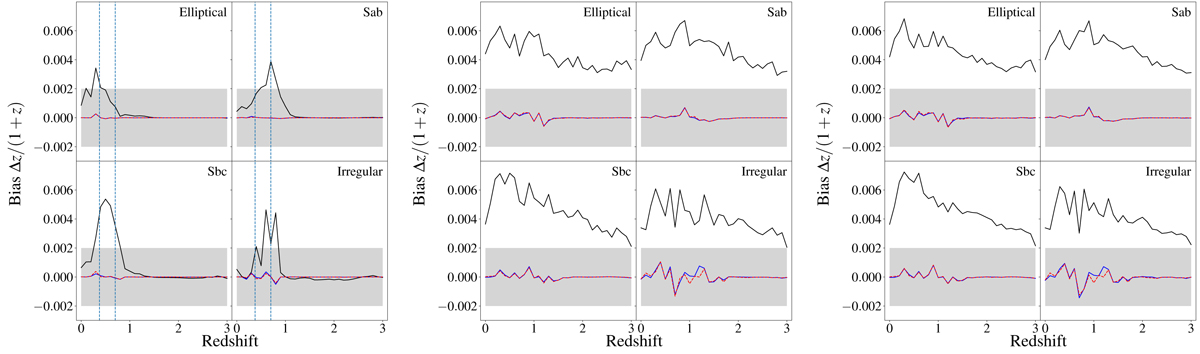
Fig. 7.
Download original image
Bias in the photometric redshifts due to passband variations as a function of redshift in the MegaCam ugriz + Euclid YEJEHE configuration. Each plot shows the bias for the four CWW templates, as indicated. Left: only the r passband is variable; centre: all passbands are variable; right: all passbands are variable, and four exposures have been stacked. In the left plot, the vertical dashed lines indicate the redshifts where the Balmer break enters and exits the r passband. The different curves show the bias when the passband variations are ignored (black line), or when the full central passbands corrected for the shifts in mean wavelengths (blue line) are used. The dashed red lines show the bias when the second-order polynomial correction on the flux presented in Sect. 5.2 is used. We point out that the blue and red lines are very close, so that the blue line is often barely visible.
Current usage metrics show cumulative count of Article Views (full-text article views including HTML views, PDF and ePub downloads, according to the available data) and Abstracts Views on Vision4Press platform.
Data correspond to usage on the plateform after 2015. The current usage metrics is available 48-96 hours after online publication and is updated daily on week days.
Initial download of the metrics may take a while.