Open Access
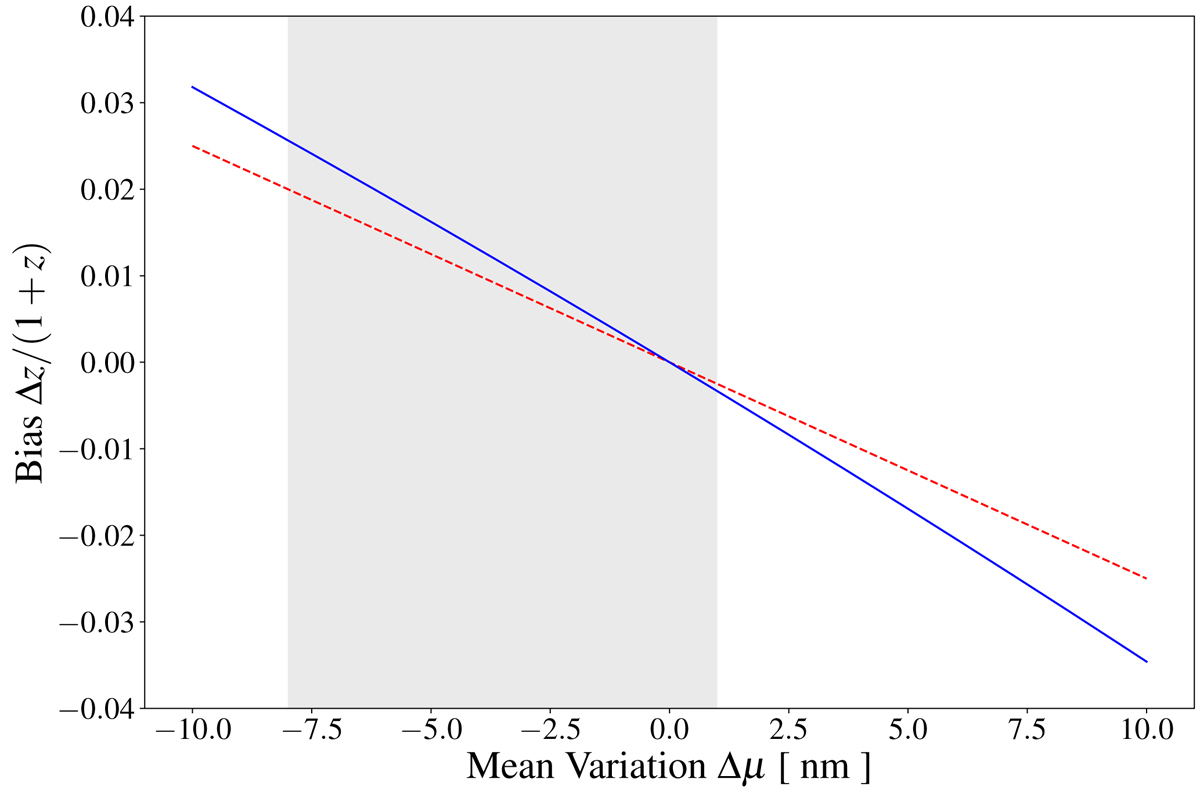
Fig. 6.
Download original image
Bias Δz resulting from a shift of Δμ in the G passband for z = 0.15 (solid blue line). The dashed red line is the “theoretical” bias Δμ/400 nm, where Δμ is the error on the location of the Balmer break. The grey area shows the domain of variations of the mean wavelengths of the measured MegaCam r passbands (from 0 to 8 nm).
Current usage metrics show cumulative count of Article Views (full-text article views including HTML views, PDF and ePub downloads, according to the available data) and Abstracts Views on Vision4Press platform.
Data correspond to usage on the plateform after 2015. The current usage metrics is available 48-96 hours after online publication and is updated daily on week days.
Initial download of the metrics may take a while.