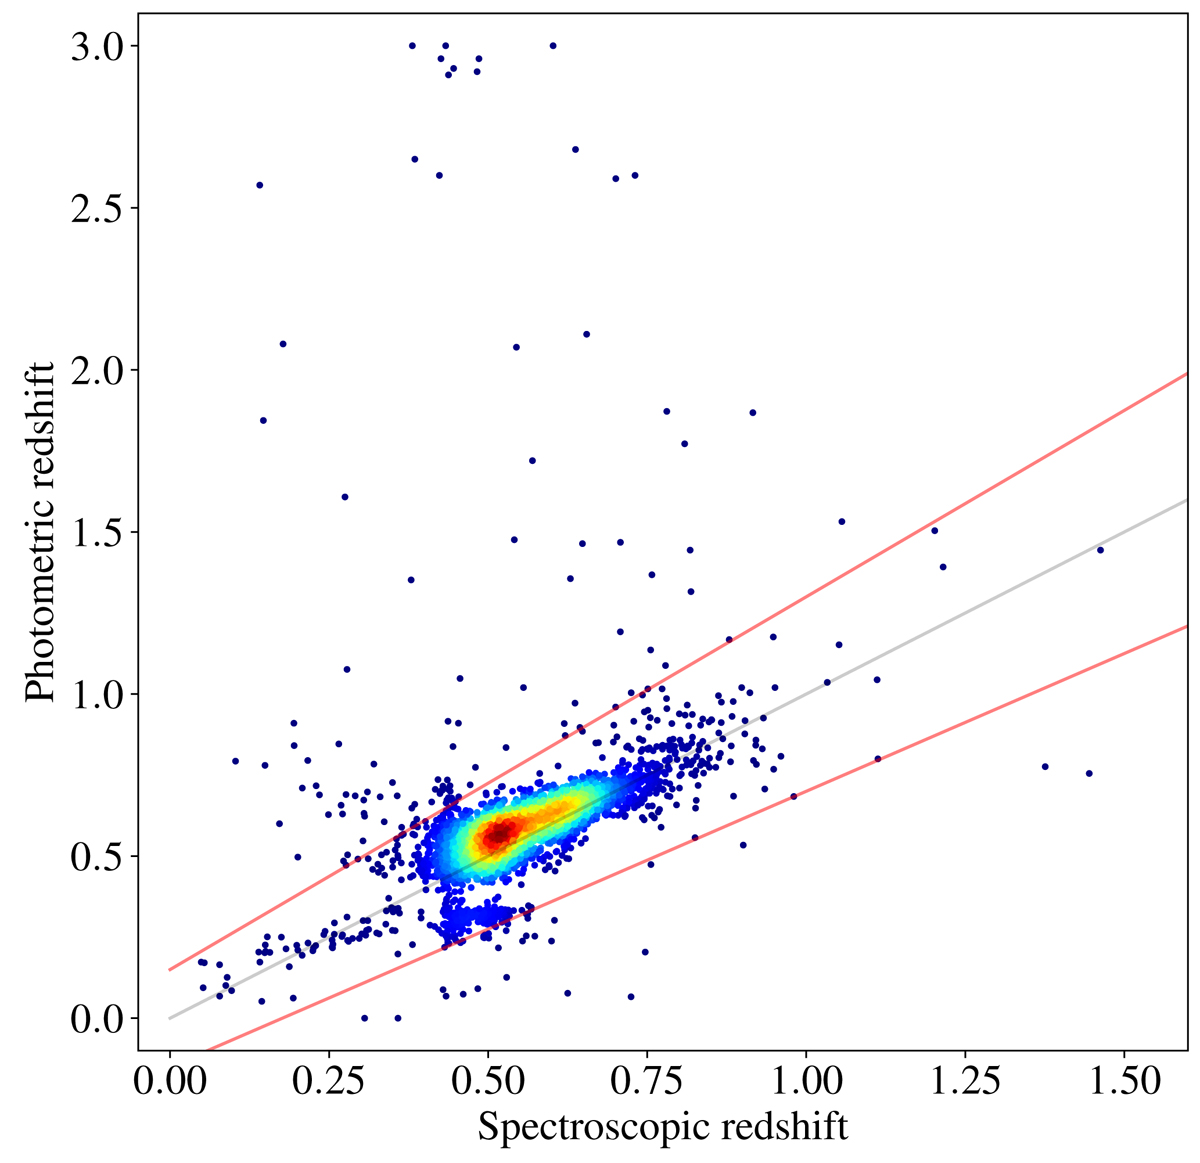
Fig. 10.
Download original image
Photometric-redshift predictions for the W1 CFHTLS catalogue of bright galaxies with secure redshifts presented as a density plot in the photometric-redshift–spectroscopic-redshift plane. The grey solid line is the 1:1 line. The red lines show the limits 0.85(1 + z) and 1.15(1 + z), respectively, traditionally separating good predictions from outliers.
Current usage metrics show cumulative count of Article Views (full-text article views including HTML views, PDF and ePub downloads, according to the available data) and Abstracts Views on Vision4Press platform.
Data correspond to usage on the plateform after 2015. The current usage metrics is available 48-96 hours after online publication and is updated daily on week days.
Initial download of the metrics may take a while.