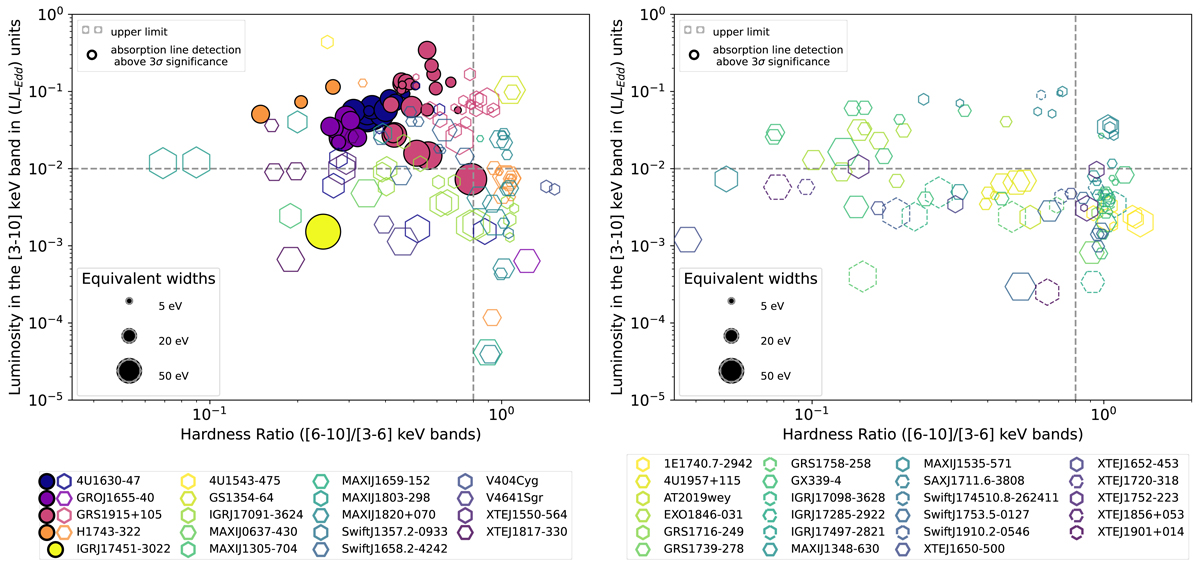
Fig. 8.
Download original image
Hardness intensity diagram with the position of all detections in the sample and Fe XXVI Kα upper limits when no line was detected. The diagram uses the same inclination split as in Fig. 2. The vertical and horizontal lines highlight the luminosity and HR thresholds proposed in Sect. 4.2. Sources with no inclination measurements in the right panel are shown with dashed markers.
Current usage metrics show cumulative count of Article Views (full-text article views including HTML views, PDF and ePub downloads, according to the available data) and Abstracts Views on Vision4Press platform.
Data correspond to usage on the plateform after 2015. The current usage metrics is available 48-96 hours after online publication and is updated daily on week days.
Initial download of the metrics may take a while.