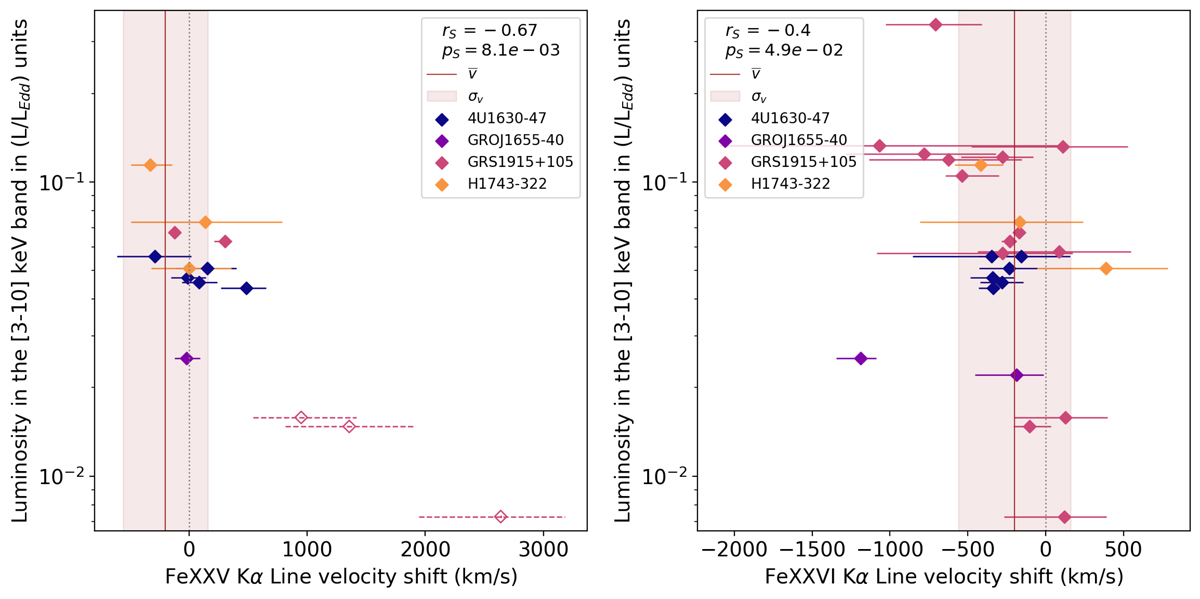
Fig. 4.
Download original image
Scatter plot of the Fe XXV Kα (left) and Fe XXVI Kα (right) velocity shifts against luminosity in Chandra observations. The scatter plot is color coded according to the sources. The gray dotted line corresponds to zero velocity and the brown line to the mean of the curated Kα blueshift distribution, whose standard deviation is visualized by the brown region. The biased Fe XXV Kα blueshifts measured in the obscured GRS 1915+105 observations, which are excluded from this distribution, are marked in dashes.
Current usage metrics show cumulative count of Article Views (full-text article views including HTML views, PDF and ePub downloads, according to the available data) and Abstracts Views on Vision4Press platform.
Data correspond to usage on the plateform after 2015. The current usage metrics is available 48-96 hours after online publication and is updated daily on week days.
Initial download of the metrics may take a while.