Fig. 2.
Download original image
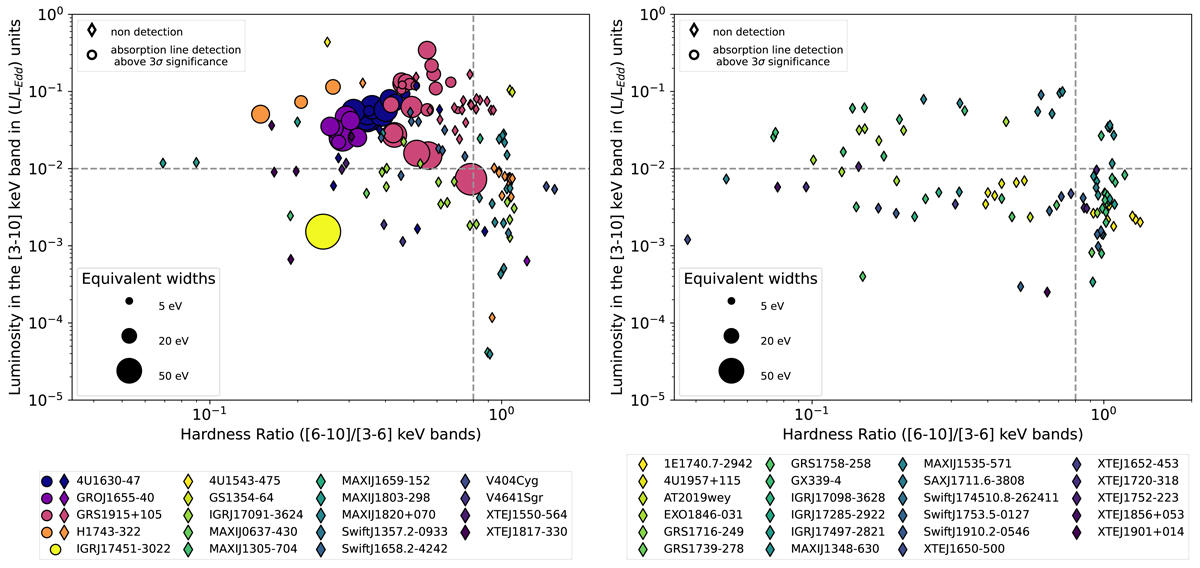
Hardness intensity diagram with the position of all line detections in the sample. The sample is split according to the viewing angle: the left panel is restricted to dippers, or sources, with i > 55°, while the right panel shows all other sources. The vertical and horizontal lines highlight the luminosity and HR thresholds proposed in Sect. 4.2.
Current usage metrics show cumulative count of Article Views (full-text article views including HTML views, PDF and ePub downloads, according to the available data) and Abstracts Views on Vision4Press platform.
Data correspond to usage on the plateform after 2015. The current usage metrics is available 48-96 hours after online publication and is updated daily on week days.
Initial download of the metrics may take a while.