Fig. B.1.
Download original image
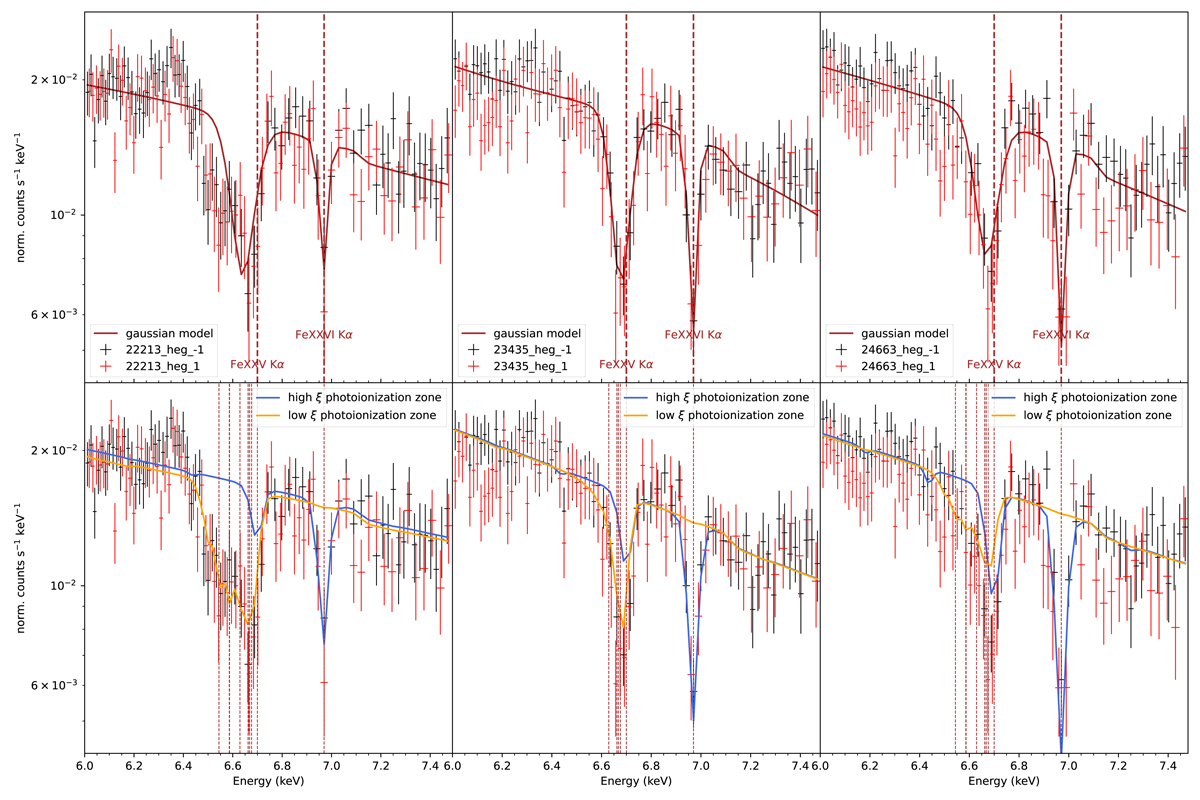
Zoom of the fit around the Kα lines for the three low-luminosity observations of GRS 195+105+105. The upper panels show the results of the autofit procedure with Gaussians, and the lower panels show the results of a fit with two photoionization zones; the lower ξ was fixed at zero velocity. The dashed lines show the energy of the main lines affecting the photoionization zones of each observation.
Current usage metrics show cumulative count of Article Views (full-text article views including HTML views, PDF and ePub downloads, according to the available data) and Abstracts Views on Vision4Press platform.
Data correspond to usage on the plateform after 2015. The current usage metrics is available 48-96 hours after online publication and is updated daily on week days.
Initial download of the metrics may take a while.