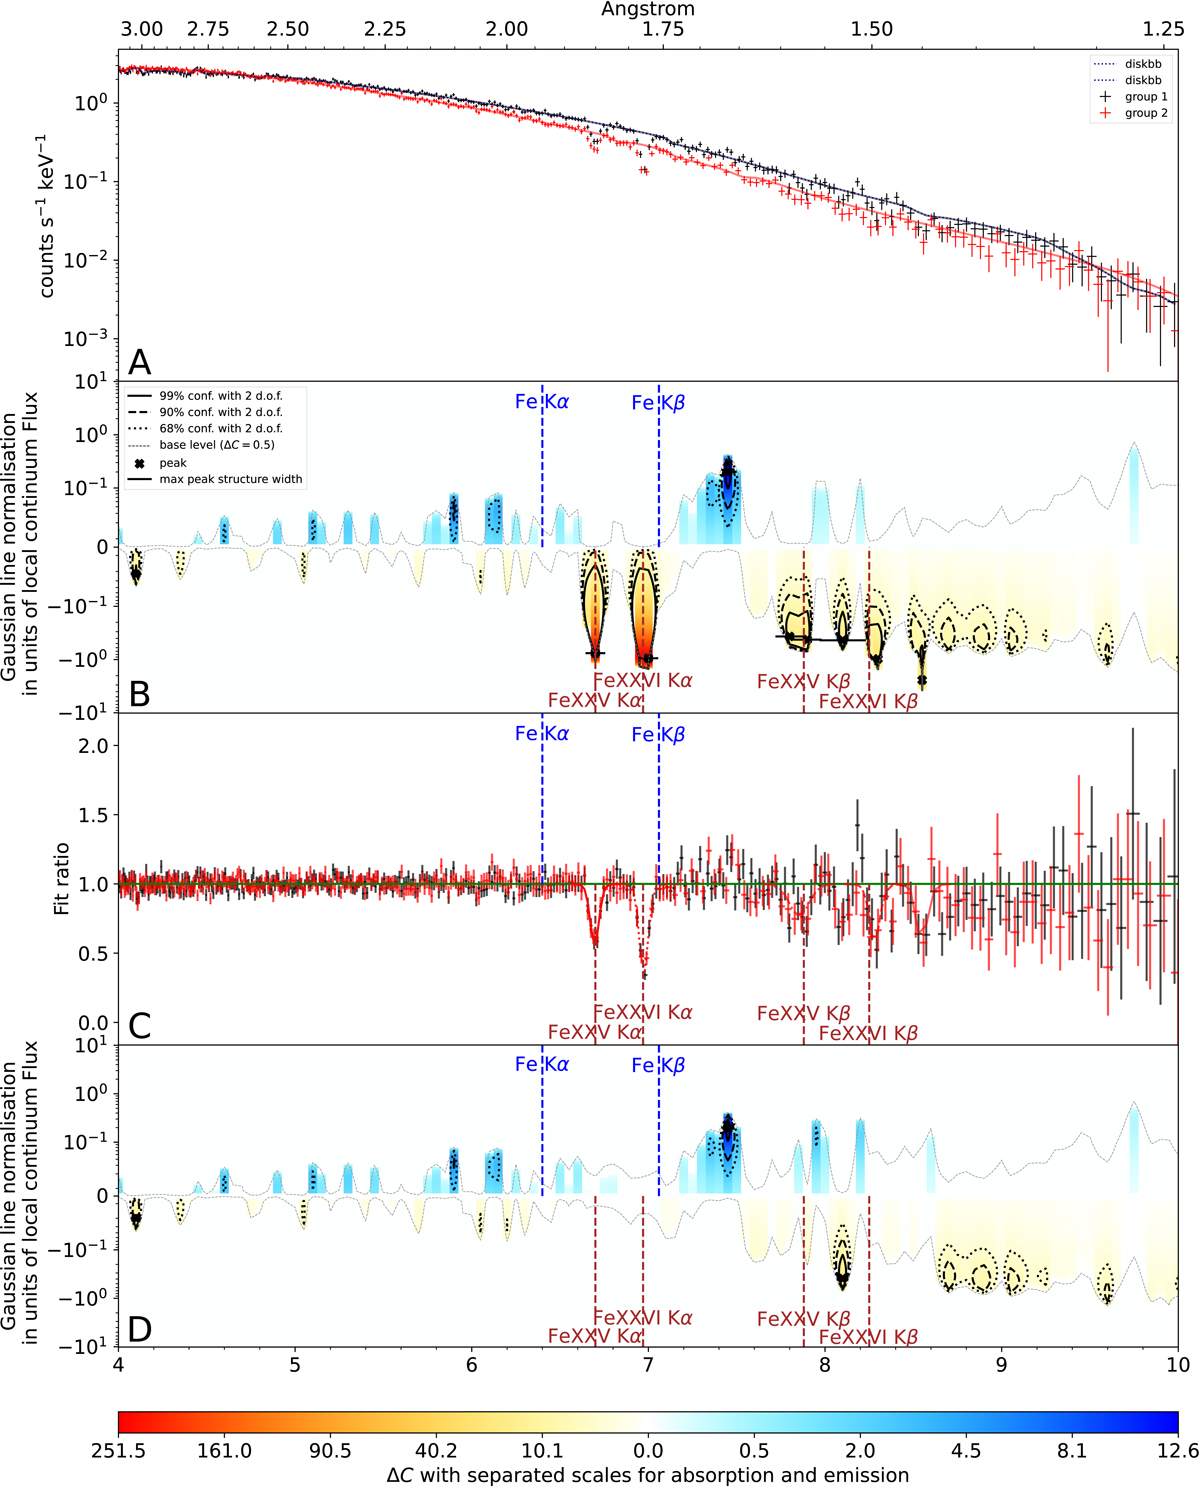
Fig. 1.
Download original image
Steps of the line detection procedure for a standard 4U130-47 Chandra spectra. Panel A: spectrum in the 4–10 keV band after the first continuum fit in this band. Panel B: map of the line blind search restricted to positive regions ΔC (i.e., improvements of the fit). Standard confidence intervals are highlighted with different line styles, and the color map shows the ΔC improvements of emission and absorption lines. Panel C: ratio plot of the best fit model once absorption lines are added. Panel D: remaining residuals seen through a second blind search.
Current usage metrics show cumulative count of Article Views (full-text article views including HTML views, PDF and ePub downloads, according to the available data) and Abstracts Views on Vision4Press platform.
Data correspond to usage on the plateform after 2015. The current usage metrics is available 48-96 hours after online publication and is updated daily on week days.
Initial download of the metrics may take a while.