Fig. 9
Download original image
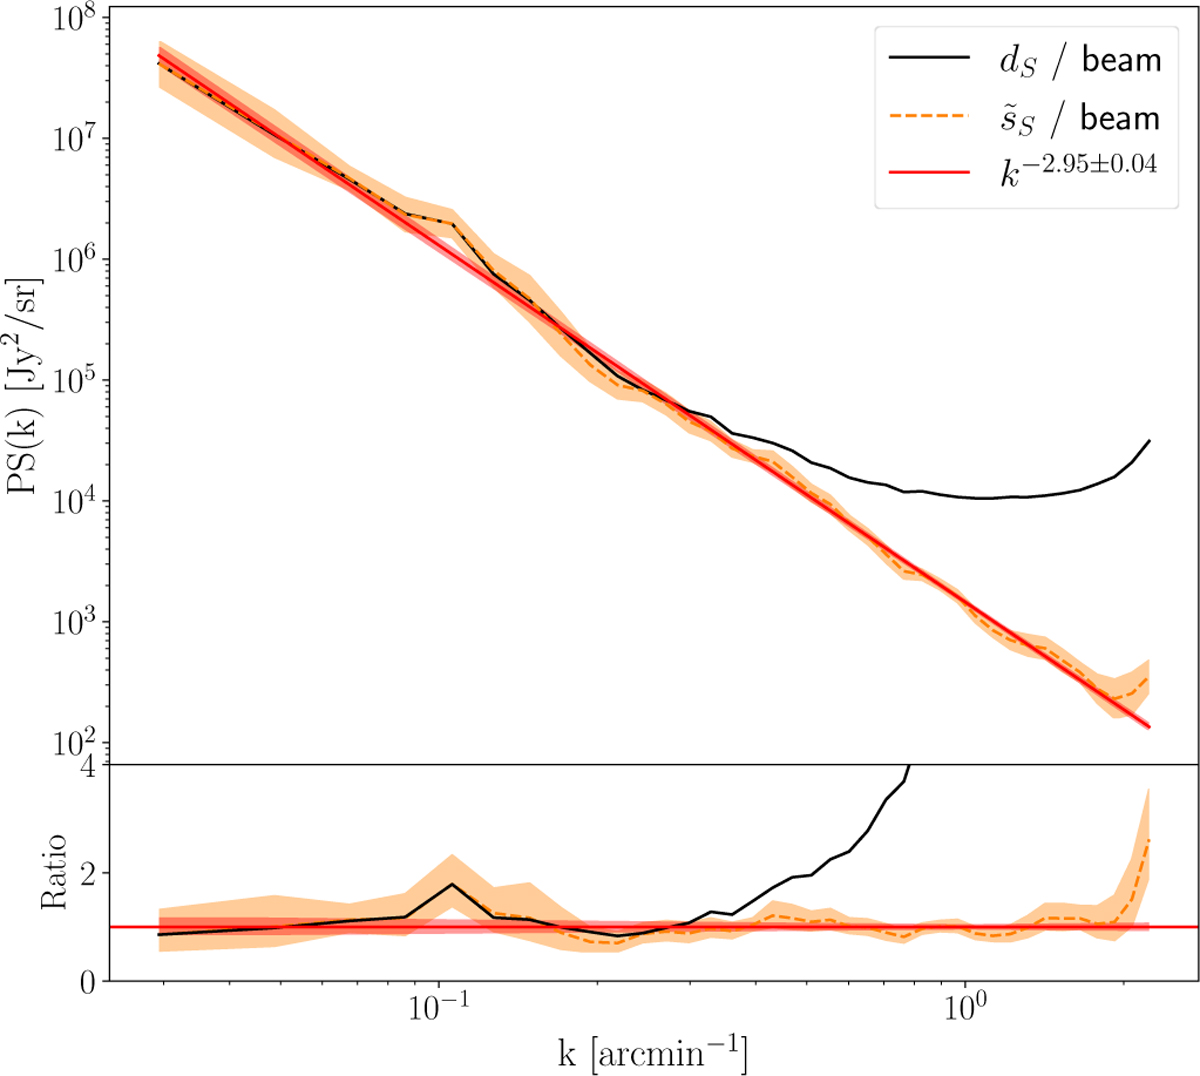
Power spectra of the input and output maps for the component separation applied to Herschel SPIRE maps at 250 μm. Top: beam-corrected power spectrum of dS, beam-corrected power spectrum of ![]() and its power-law fit. Bottom: ratio with the power-law fit. The colored bands represent ±1σ error-bars. The component separation extends the scale range where the dust power spectrum is found to have a power-law shape by a factor of 6.
and its power-law fit. Bottom: ratio with the power-law fit. The colored bands represent ±1σ error-bars. The component separation extends the scale range where the dust power spectrum is found to have a power-law shape by a factor of 6.
Current usage metrics show cumulative count of Article Views (full-text article views including HTML views, PDF and ePub downloads, according to the available data) and Abstracts Views on Vision4Press platform.
Data correspond to usage on the plateform after 2015. The current usage metrics is available 48-96 hours after online publication and is updated daily on week days.
Initial download of the metrics may take a while.