Open Access
Fig. 8
Download original image
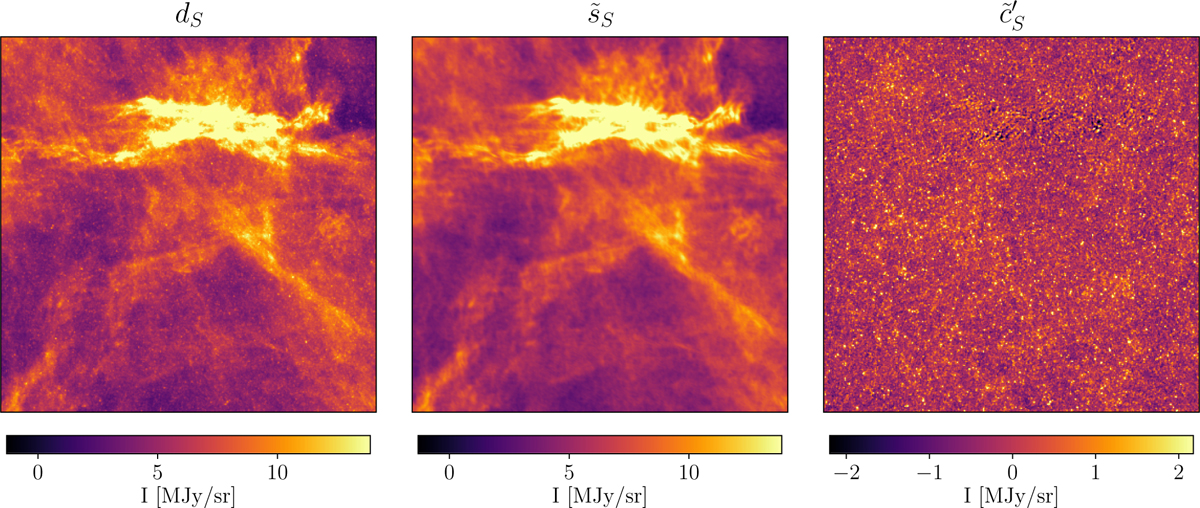
Input and output maps for the component separation applied to Herschel SPIRE maps at 250 μm. Left: map of the Spider field dS. Center: output dust map ![]() . Right: output contamination map
. Right: output contamination map ![]() . The dS map is separated into two components: the dust,
. The dS map is separated into two components: the dust, ![]() , and the CIB+noise contamination,
, and the CIB+noise contamination, ![]() .
.
Current usage metrics show cumulative count of Article Views (full-text article views including HTML views, PDF and ePub downloads, according to the available data) and Abstracts Views on Vision4Press platform.
Data correspond to usage on the plateform after 2015. The current usage metrics is available 48-96 hours after online publication and is updated daily on week days.
Initial download of the metrics may take a while.