Fig. 6
Download original image
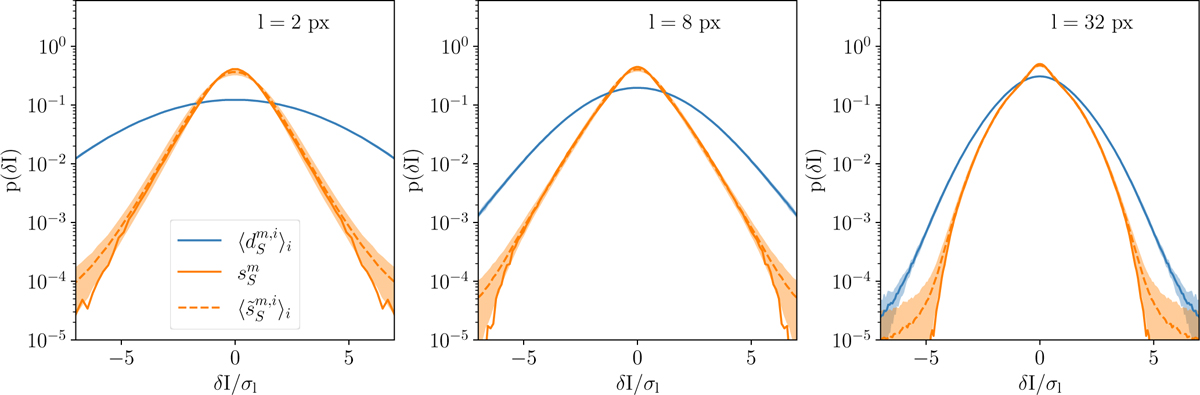
PDFs of increments of the dust intensity for the input and output maps of the component separation applied to the mock data. The PDFs of ![]() ,
, ![]() and
and ![]() are compared for three lag values: 2 pixels (left), 8 (middle), and 32 (right). The PDFs are plotted as a function of δI/σl, where σl is the standard deviation of the increments of
are compared for three lag values: 2 pixels (left), 8 (middle), and 32 (right). The PDFs are plotted as a function of δI/σl, where σl is the standard deviation of the increments of ![]() at lag l. The colored bands represent ±1σ error-bars.
at lag l. The colored bands represent ±1σ error-bars.
Current usage metrics show cumulative count of Article Views (full-text article views including HTML views, PDF and ePub downloads, according to the available data) and Abstracts Views on Vision4Press platform.
Data correspond to usage on the plateform after 2015. The current usage metrics is available 48-96 hours after online publication and is updated daily on week days.
Initial download of the metrics may take a while.