Fig. 4
Download original image
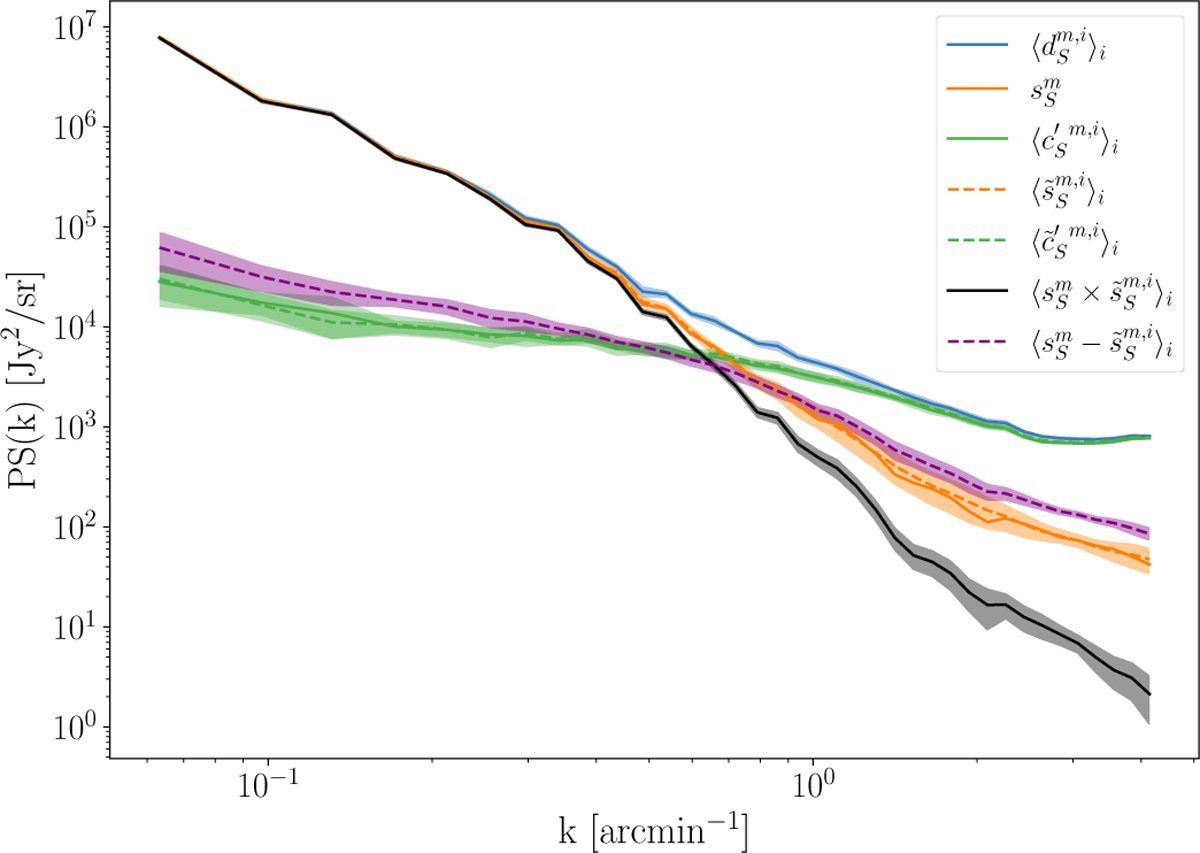
Power spectra of the input and output maps of the component separation applied to the mock data. The figure shows the power spectra of ![]() ,
, ![]() ,
, ![]() ,
, ![]() ,
, ![]() , and
, and ![]() as well as the cross spectrum between
as well as the cross spectrum between ![]() and
and ![]() . The notation 〈•〉i represents the mean of the spectra computed over the 72 separation runs. The colored bands represent ±1σ error-bars, computed as the standard deviation of these spectra. The component separation allows to recover the power spectra of the input maps within statistical uncertainties.
. The notation 〈•〉i represents the mean of the spectra computed over the 72 separation runs. The colored bands represent ±1σ error-bars, computed as the standard deviation of these spectra. The component separation allows to recover the power spectra of the input maps within statistical uncertainties.
Current usage metrics show cumulative count of Article Views (full-text article views including HTML views, PDF and ePub downloads, according to the available data) and Abstracts Views on Vision4Press platform.
Data correspond to usage on the plateform after 2015. The current usage metrics is available 48-96 hours after online publication and is updated daily on week days.
Initial download of the metrics may take a while.