Fig. 3
Download original image
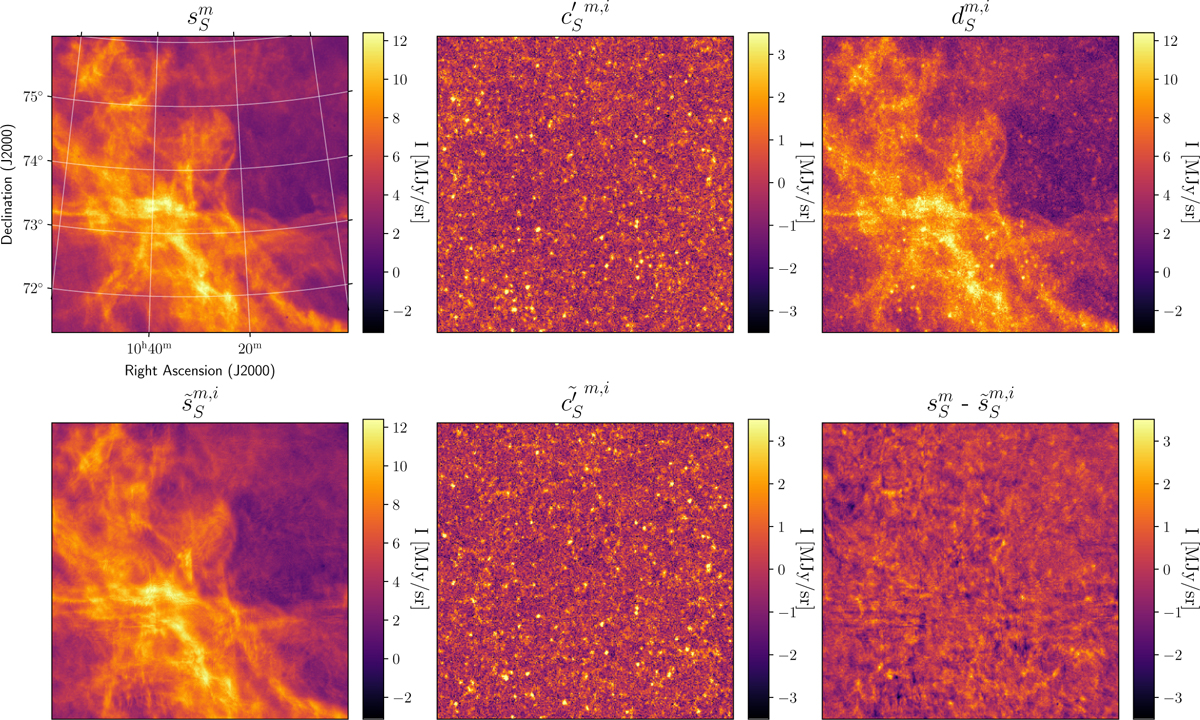
Input and output maps for the component separation applied to the mock data. The three top images show the input dust map ![]() (left), one example of the input contamination
(left), one example of the input contamination ![]() (middle), and the mock data
(middle), and the mock data ![]() (right). The three bottom images show output maps from the component separation: the dust map
(right). The three bottom images show output maps from the component separation: the dust map ![]() (left), the contamination
(left), the contamination ![]() (middle), and the difference
(middle), and the difference ![]() (right).
(right).
Current usage metrics show cumulative count of Article Views (full-text article views including HTML views, PDF and ePub downloads, according to the available data) and Abstracts Views on Vision4Press platform.
Data correspond to usage on the plateform after 2015. The current usage metrics is available 48-96 hours after online publication and is updated daily on week days.
Initial download of the metrics may take a while.