Fig. D.1
Download original image
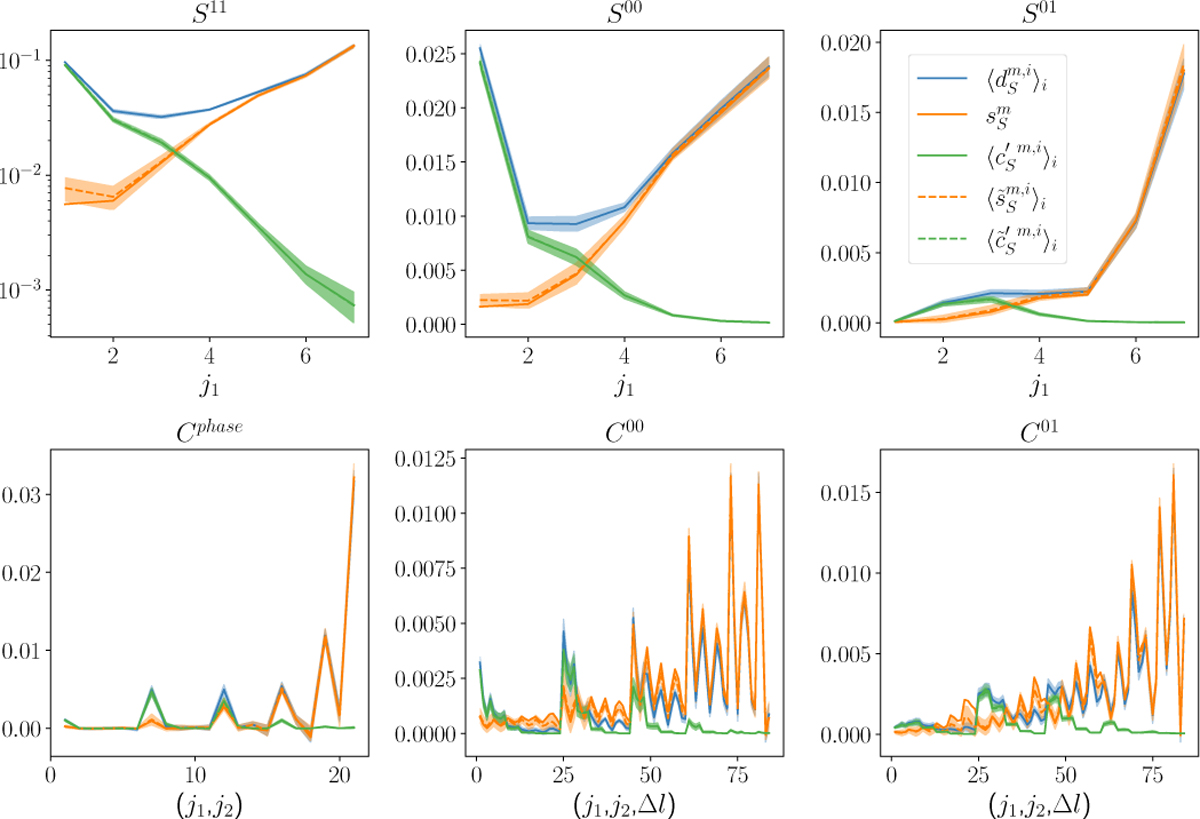
WPH statistics of the input and output maps for the component separation applied on the mock data. The WPH statistics of ![]() ,
, ![]() ,
, ![]() ,
, ![]() and
and ![]() are compared. The 〈•〉i notes the mean of the WPH statistics computed over the 9 separations done using different sub-maps (see Sect. 4.1 for mock data construction). The colored bands represent ±1σ error-bars, computed as the standard deviation of these statistics.
are compared. The 〈•〉i notes the mean of the WPH statistics computed over the 9 separations done using different sub-maps (see Sect. 4.1 for mock data construction). The colored bands represent ±1σ error-bars, computed as the standard deviation of these statistics.
Current usage metrics show cumulative count of Article Views (full-text article views including HTML views, PDF and ePub downloads, according to the available data) and Abstracts Views on Vision4Press platform.
Data correspond to usage on the plateform after 2015. The current usage metrics is available 48-96 hours after online publication and is updated daily on week days.
Initial download of the metrics may take a while.