Fig. 13
Download original image
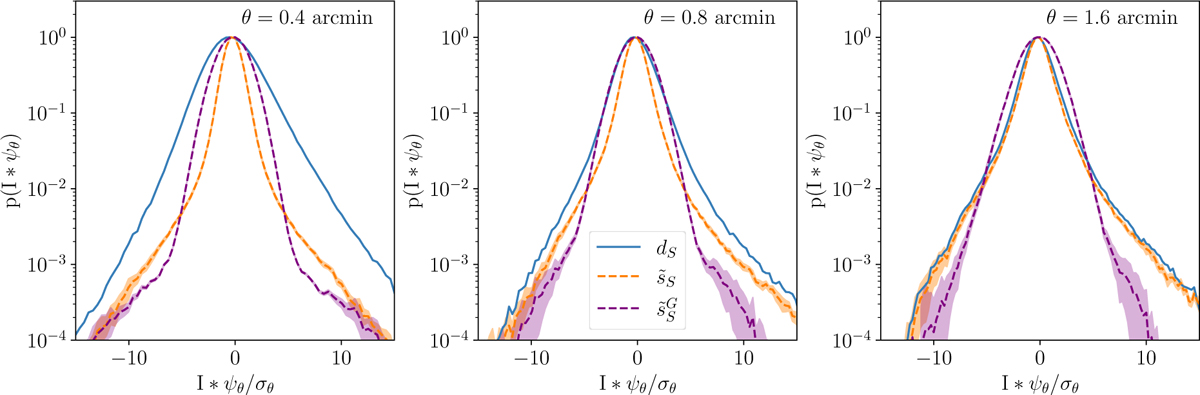
Wavelet coefficents of the input and output dust maps for the component separation applied on the Herschel Spider map. The PDFs of the real part of the wavelet coefficients of dS, ![]() , and
, and ![]() are compared at scales θ = 0.4, 0.8, and 1.6′. They are displayed as a function of I * ψθ/σθ where ψθ is the wavelet at scale θ and σθ is the standard deviation of the wavelet coefficients. We employed the same oriented wavelets as those used to calculate WPH statistics. The PDFs are computed over all the pixels of the eight convolution maps obtained using the wavelets of different orientations. The colored bands represent ±1σ error-bars.
are compared at scales θ = 0.4, 0.8, and 1.6′. They are displayed as a function of I * ψθ/σθ where ψθ is the wavelet at scale θ and σθ is the standard deviation of the wavelet coefficients. We employed the same oriented wavelets as those used to calculate WPH statistics. The PDFs are computed over all the pixels of the eight convolution maps obtained using the wavelets of different orientations. The colored bands represent ±1σ error-bars.
Current usage metrics show cumulative count of Article Views (full-text article views including HTML views, PDF and ePub downloads, according to the available data) and Abstracts Views on Vision4Press platform.
Data correspond to usage on the plateform after 2015. The current usage metrics is available 48-96 hours after online publication and is updated daily on week days.
Initial download of the metrics may take a while.