Fig. 10
Download original image
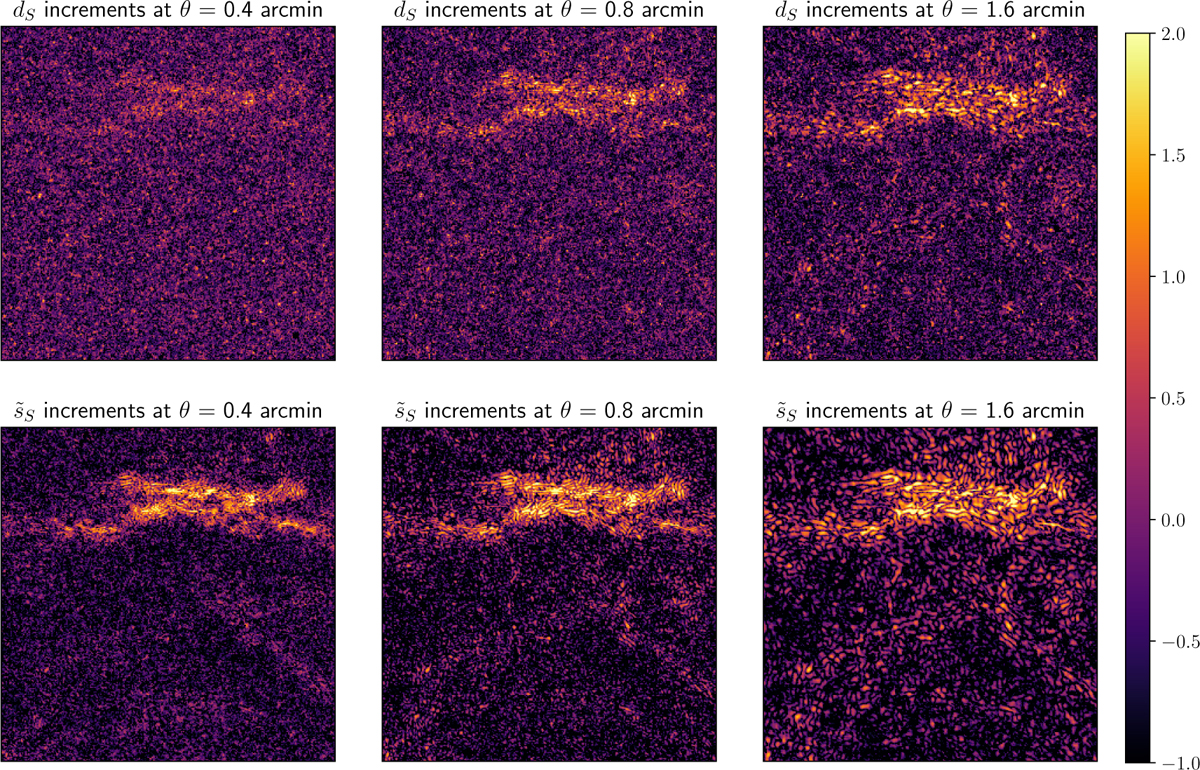
Maps of increments for the component separation applied to Herschel Spider observations. The Neperian logarithm of the absolute value of the increments computed at θ = 0.4, 0.8, and 1.6 arcmin lags are compared for the input (dS, top row) and output (![]() , bottom row) maps. We substracted the log of the standard deviation of each map. Zooming in on these maps allows for a review of the smallest scales.
, bottom row) maps. We substracted the log of the standard deviation of each map. Zooming in on these maps allows for a review of the smallest scales.
Current usage metrics show cumulative count of Article Views (full-text article views including HTML views, PDF and ePub downloads, according to the available data) and Abstracts Views on Vision4Press platform.
Data correspond to usage on the plateform after 2015. The current usage metrics is available 48-96 hours after online publication and is updated daily on week days.
Initial download of the metrics may take a while.