Fig. A.1
Download original image
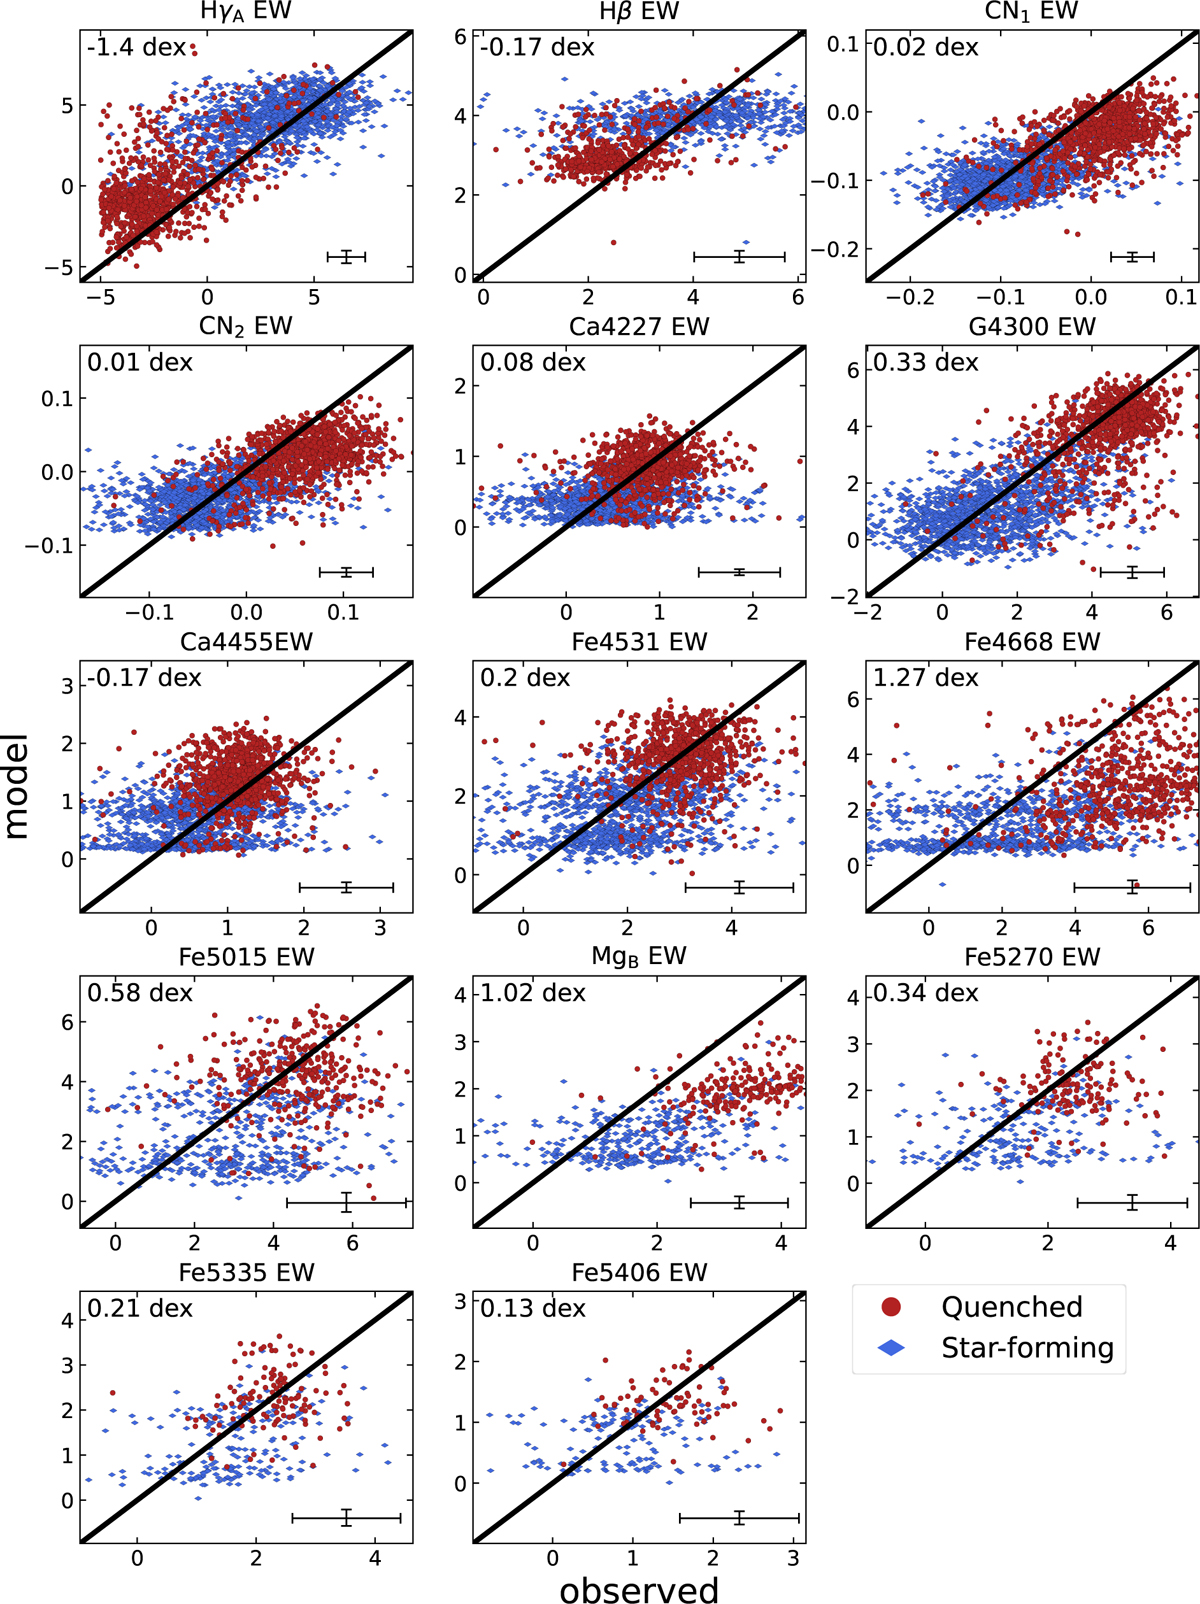
Observed absorption features compared to predictions from Prospector fits to the COSMOS2020 photometry. The galaxies are color-coded by their UVJ diagram classification as star-forming (blue diamonds) and quenched (red points). The absorption-only models are compared to the observed values (corrected for emission). The black line shows the one-to-one relation. The average offset on each Lick index is shown in the top left corner of each panel.
Current usage metrics show cumulative count of Article Views (full-text article views including HTML views, PDF and ePub downloads, according to the available data) and Abstracts Views on Vision4Press platform.
Data correspond to usage on the plateform after 2015. The current usage metrics is available 48-96 hours after online publication and is updated daily on week days.
Initial download of the metrics may take a while.