Fig. 6
Download original image
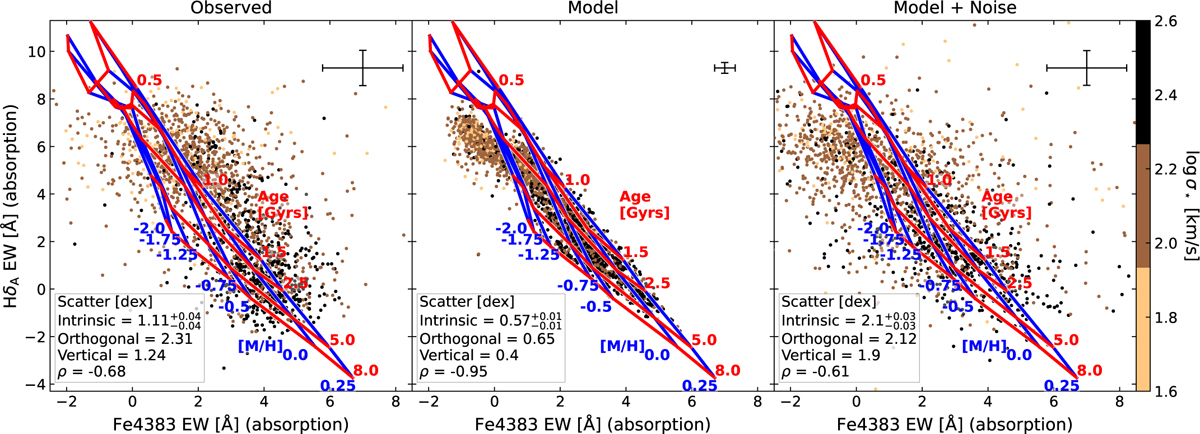
HδA vs Fe4383. Left: observed HδA vs Fe4383. Middle: predicted HδA vs Fe4383. Right: perturbed model values according to the individual observed errors. The galaxies are color-coded with log σ⋆ from the LEGA-C DR3 catalog. The SSP model grid is shown as red (age) and blue (metallicity) lines. The statistics of the scatter and the Spearman’s rank correlation coefficient (ρ) are shown in the bottom left corner of each panel. The median uncertainties of each axis are shown in the top right corner of each panel.
Current usage metrics show cumulative count of Article Views (full-text article views including HTML views, PDF and ePub downloads, according to the available data) and Abstracts Views on Vision4Press platform.
Data correspond to usage on the plateform after 2015. The current usage metrics is available 48-96 hours after online publication and is updated daily on week days.
Initial download of the metrics may take a while.