Fig. 4
Download original image
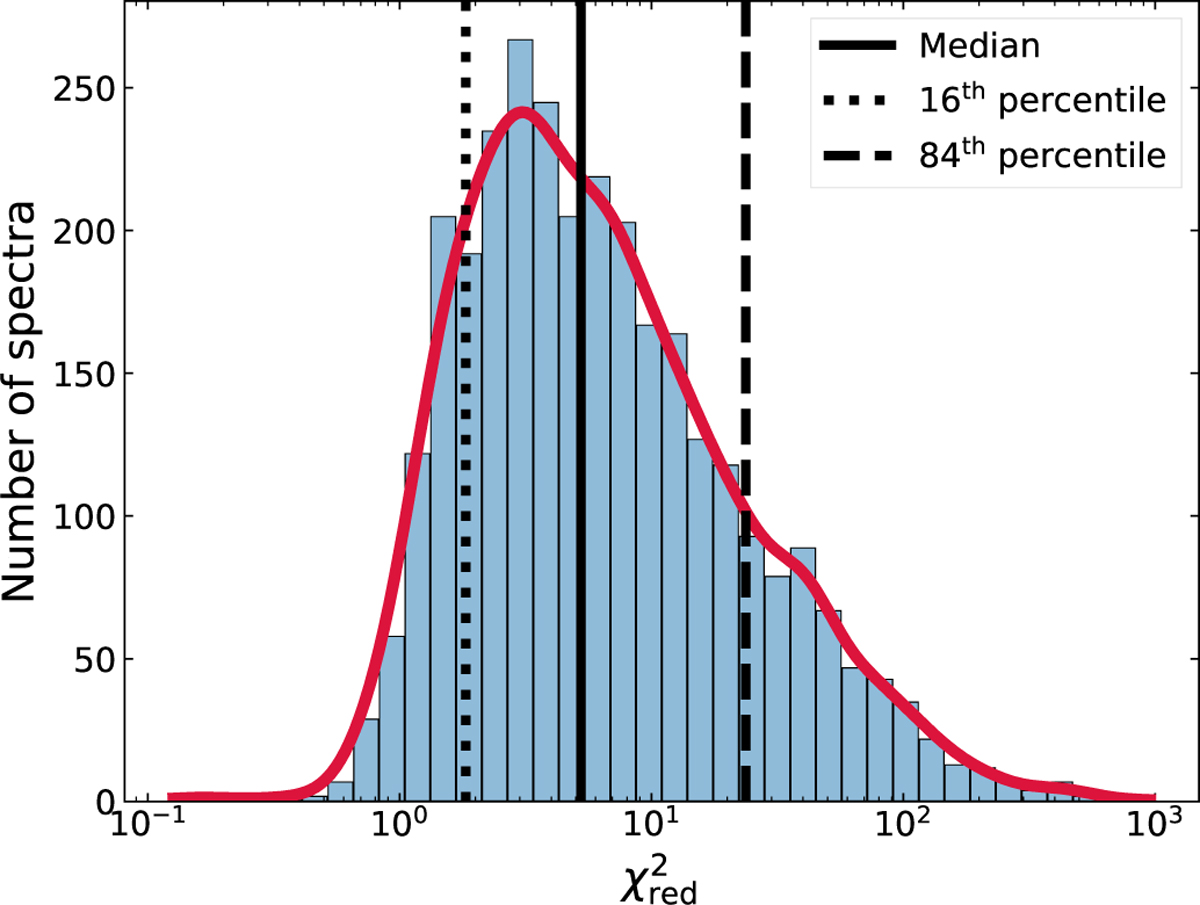
Distribution of the reduced χ2 between the predicted spectra with Prospector and the observed LEGA-C spectra. The Kernel Density Estimate (KDE) distribution is shown in red, while the solid black line shows the median value. The dotted and dashed black lines indicate the 16th and 84th percentiles of the distribution, respectively.
Current usage metrics show cumulative count of Article Views (full-text article views including HTML views, PDF and ePub downloads, according to the available data) and Abstracts Views on Vision4Press platform.
Data correspond to usage on the plateform after 2015. The current usage metrics is available 48-96 hours after online publication and is updated daily on week days.
Initial download of the metrics may take a while.