Fig. 3
Download original image
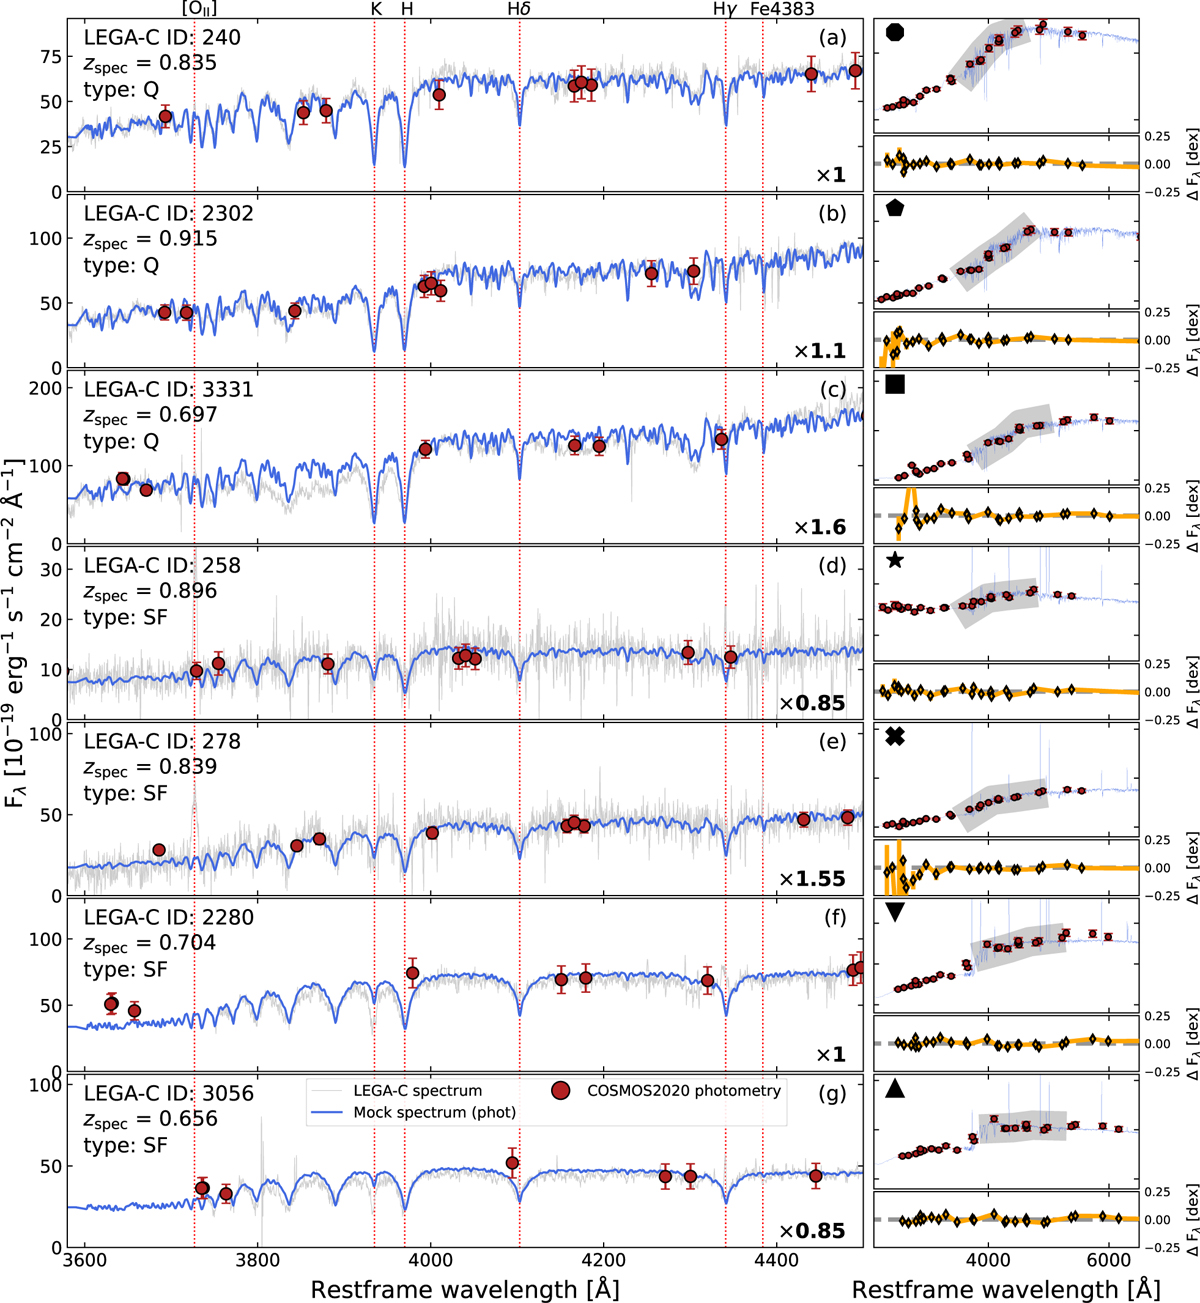
Seven randomly chosen examples of model spectra. In the left column, the silver line represents the observed spectrum, and the blue line the model spectrum without the nebular emission, predicted by fitting the COSMOS2020 flux densities (red points). The dotted red lines indicate the central wavelength of various spectral absorption features. Panels a–c show spectra that belong to quenched galaxies, while the remaining panels display spectra that correspond to star-forming galaxies. For visualization purposes and when necessary, a multiplicative factor (bottom right corner of each panel) was applied to match the photometry and predicted spectra to the observations. In the right column, the top part of each subpanel shows the full COSMOS2020 observed SED (red points) and MAP model spectrum (blue line). The shaded silver region covers the wavelength range of the corresponding LEGA-C spectra. The bottom part of each subpanel shows the difference in dex between the observations and the best-fitting photometry.
Current usage metrics show cumulative count of Article Views (full-text article views including HTML views, PDF and ePub downloads, according to the available data) and Abstracts Views on Vision4Press platform.
Data correspond to usage on the plateform after 2015. The current usage metrics is available 48-96 hours after online publication and is updated daily on week days.
Initial download of the metrics may take a while.