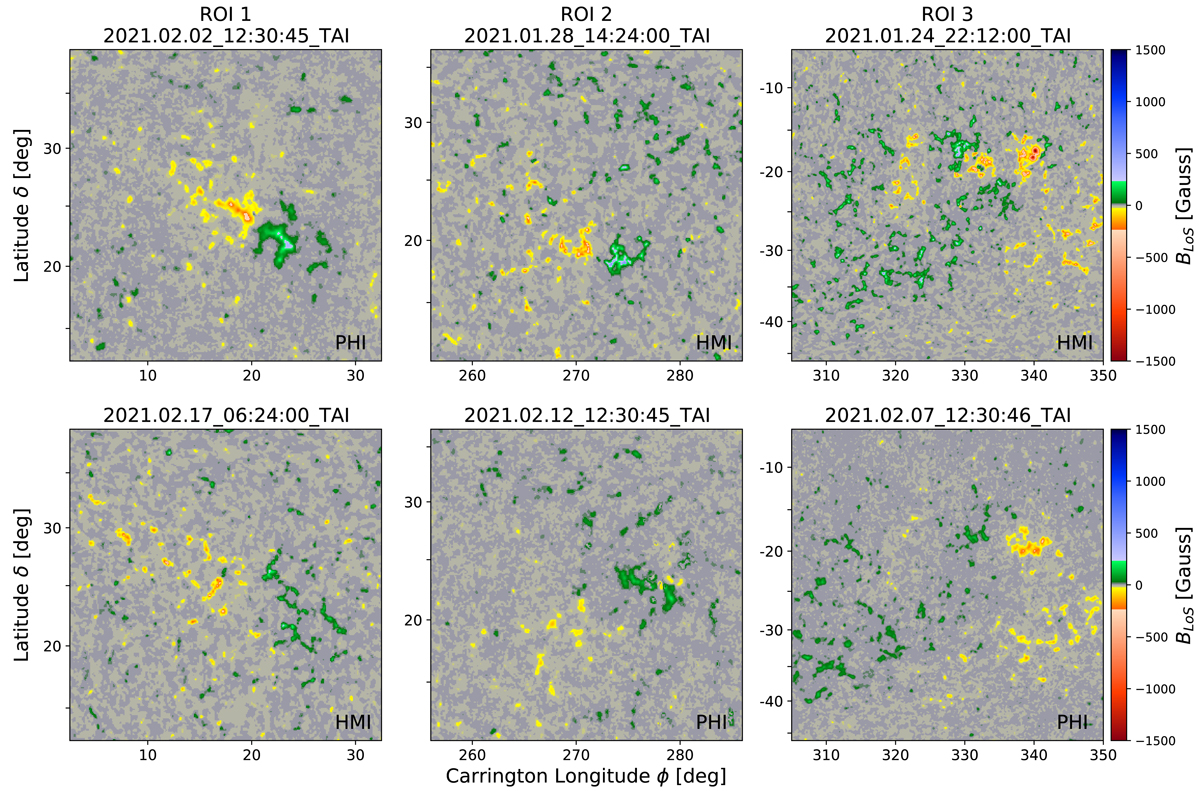
Fig. 3.
Download original image
Three regions of interest showing significant magnetic evolution between the SO/PHI and SDO/HMI observations. The panels in each column show the same region as observed at different times, with the top row showing the earlier observation. Regions 2 (NOAA 12803) and 3 (NOAA 12797 and 12798) were first observed by SDO/HMI and were observed about two weeks later by SO/PHI (see dates and times above the panels). Region 1 (NOAA 12799) was observed in reverse order, first by SDO/HMI and then by SO/PHI.
Current usage metrics show cumulative count of Article Views (full-text article views including HTML views, PDF and ePub downloads, according to the available data) and Abstracts Views on Vision4Press platform.
Data correspond to usage on the plateform after 2015. The current usage metrics is available 48-96 hours after online publication and is updated daily on week days.
Initial download of the metrics may take a while.