Fig. 7
Download original image
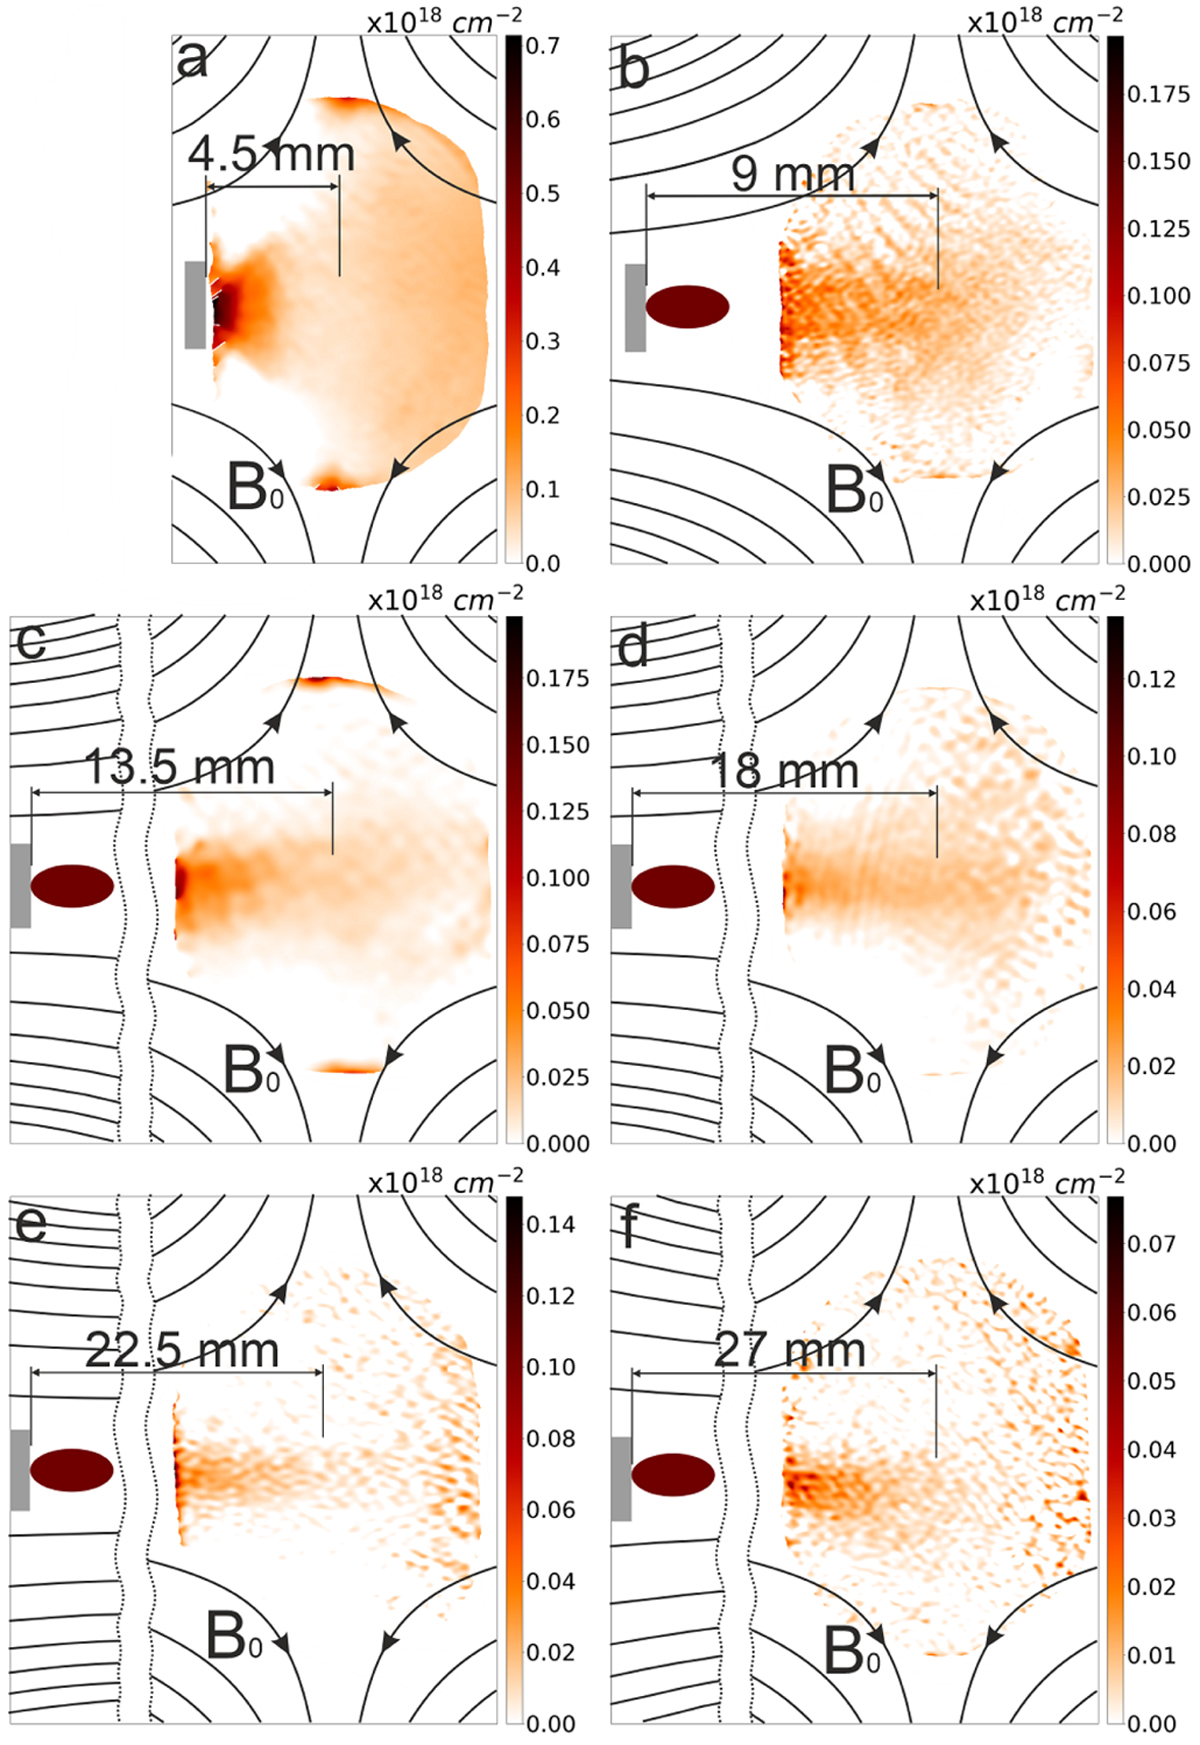
Plasma stream propagating through the zero magnetic field region for different target positions. Interferometry measurements are at 68 ns after laser irradiation of the target. The gray rectangle indicates the location of the target. To depict the position of the target and reduce the scale of the picture, panels c–f are drawn with a gap, represented by the dashed line.
Current usage metrics show cumulative count of Article Views (full-text article views including HTML views, PDF and ePub downloads, according to the available data) and Abstracts Views on Vision4Press platform.
Data correspond to usage on the plateform after 2015. The current usage metrics is available 48-96 hours after online publication and is updated daily on week days.
Initial download of the metrics may take a while.