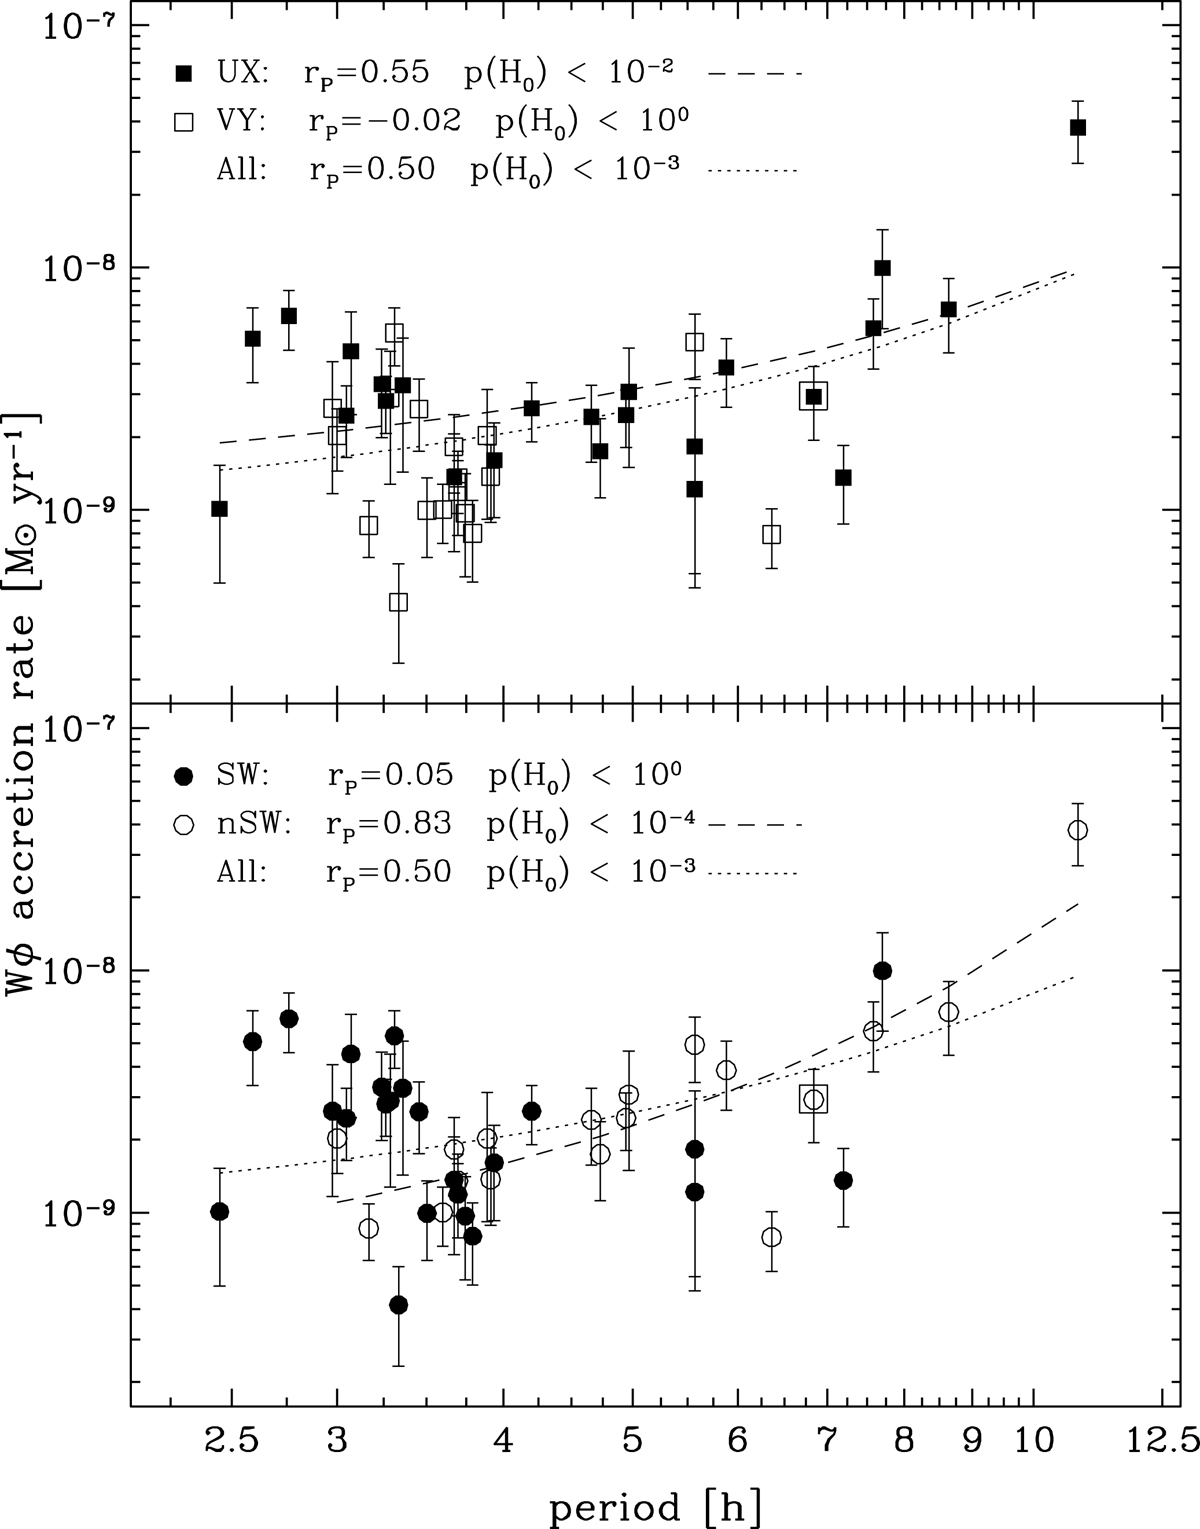
Fig. 6.
Download original image
Mass accretion rate vs. period. Relevant correlation parameters are given for all classes. Linear fit lines to the UX and nSW classes (dashed) as well as the whole sample (dotted) are plotted. They appear curved because the x-axis is rendered in log to avoid crowding of data at short periods. V426 Oph is highlighted with a square box (see last paragraph of Sect. 6.2 for details).
Current usage metrics show cumulative count of Article Views (full-text article views including HTML views, PDF and ePub downloads, according to the available data) and Abstracts Views on Vision4Press platform.
Data correspond to usage on the plateform after 2015. The current usage metrics is available 48-96 hours after online publication and is updated daily on week days.
Initial download of the metrics may take a while.