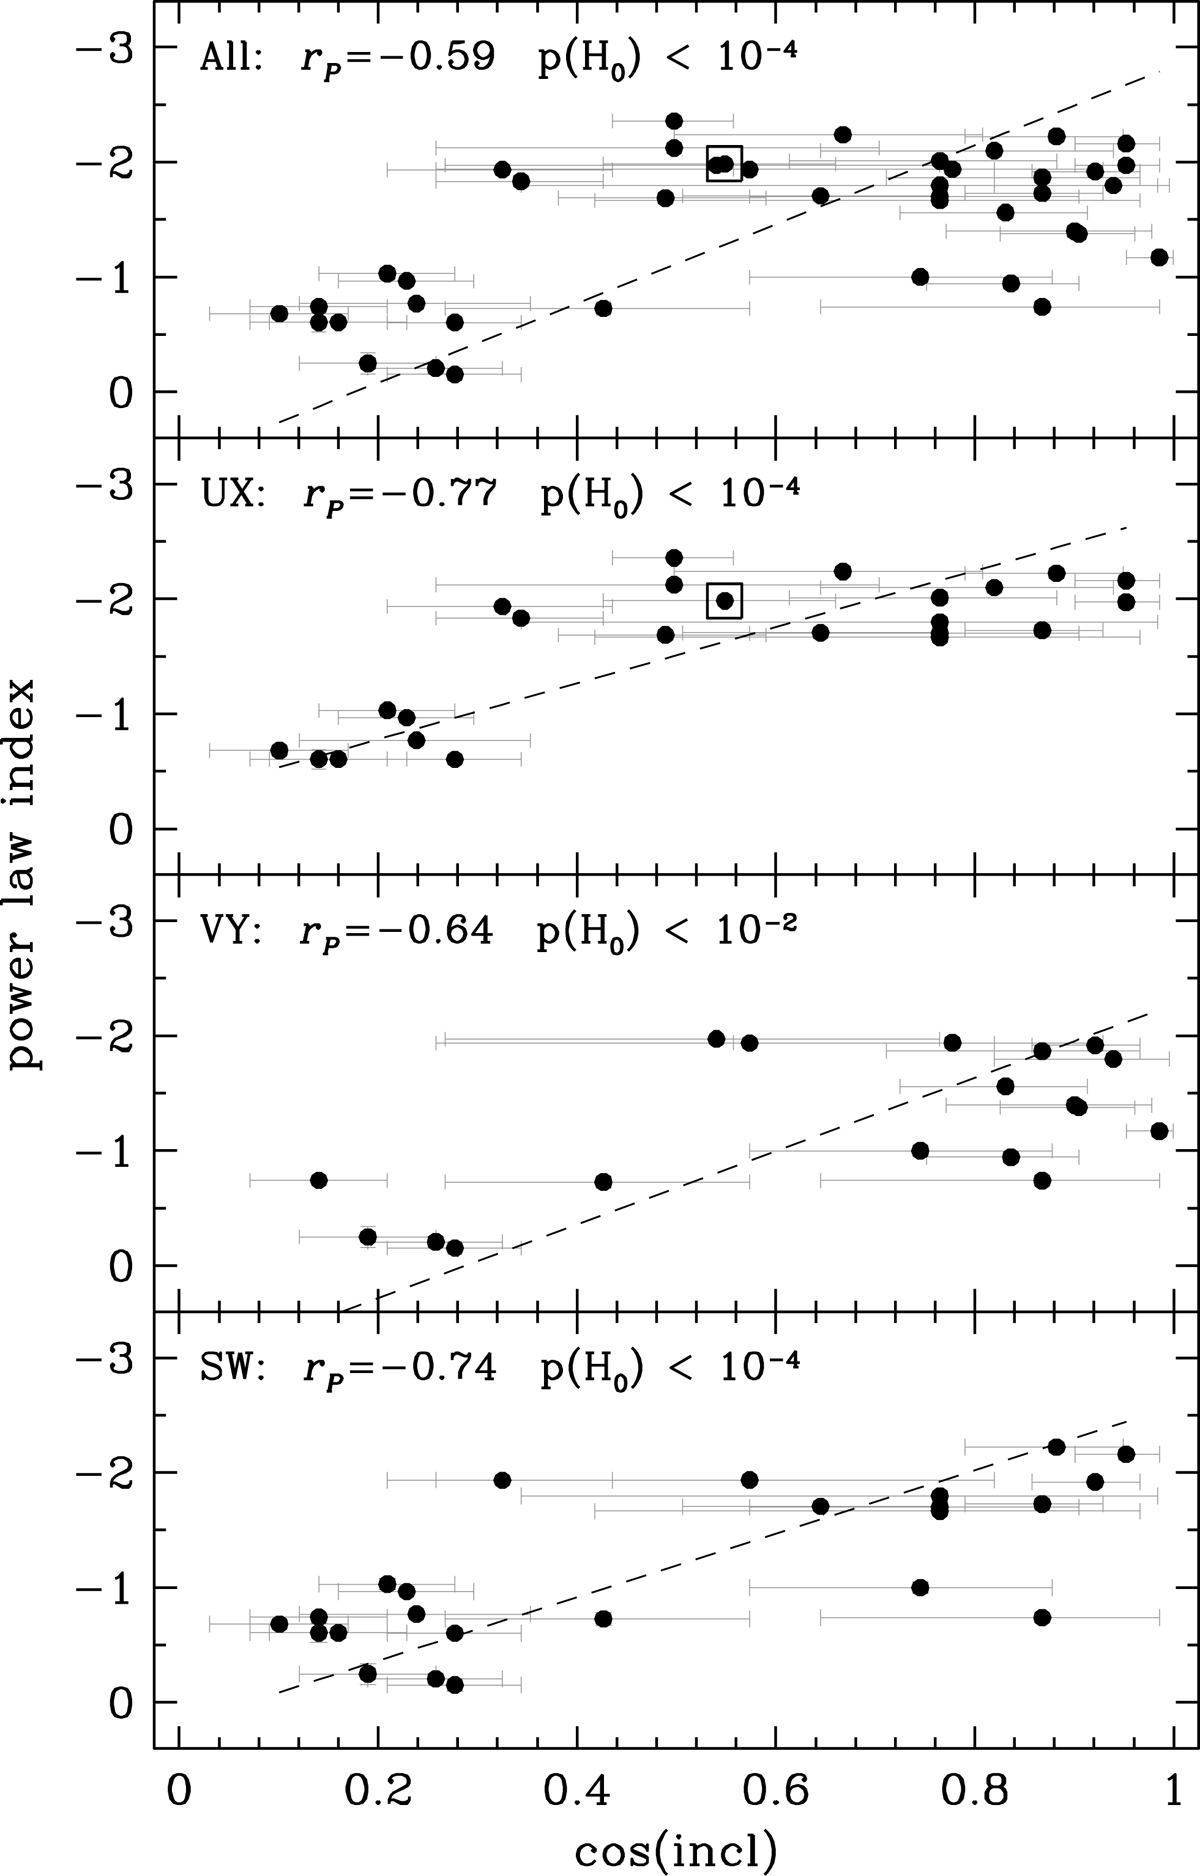
Fig. 3.
Download original image
Power-law index vs. the cosine of the inclination angle. The panels display the four correlations at pH0 < 10−2, i.e., from the top the whole sample, the UX, VY, and SW classes, each with their respective correlation parameters and fits. The nSW class shows no correlation. V426 Oph is highlighted with a square box (see last paragraph of Sect. 6.2 for details).
Current usage metrics show cumulative count of Article Views (full-text article views including HTML views, PDF and ePub downloads, according to the available data) and Abstracts Views on Vision4Press platform.
Data correspond to usage on the plateform after 2015. The current usage metrics is available 48-96 hours after online publication and is updated daily on week days.
Initial download of the metrics may take a while.