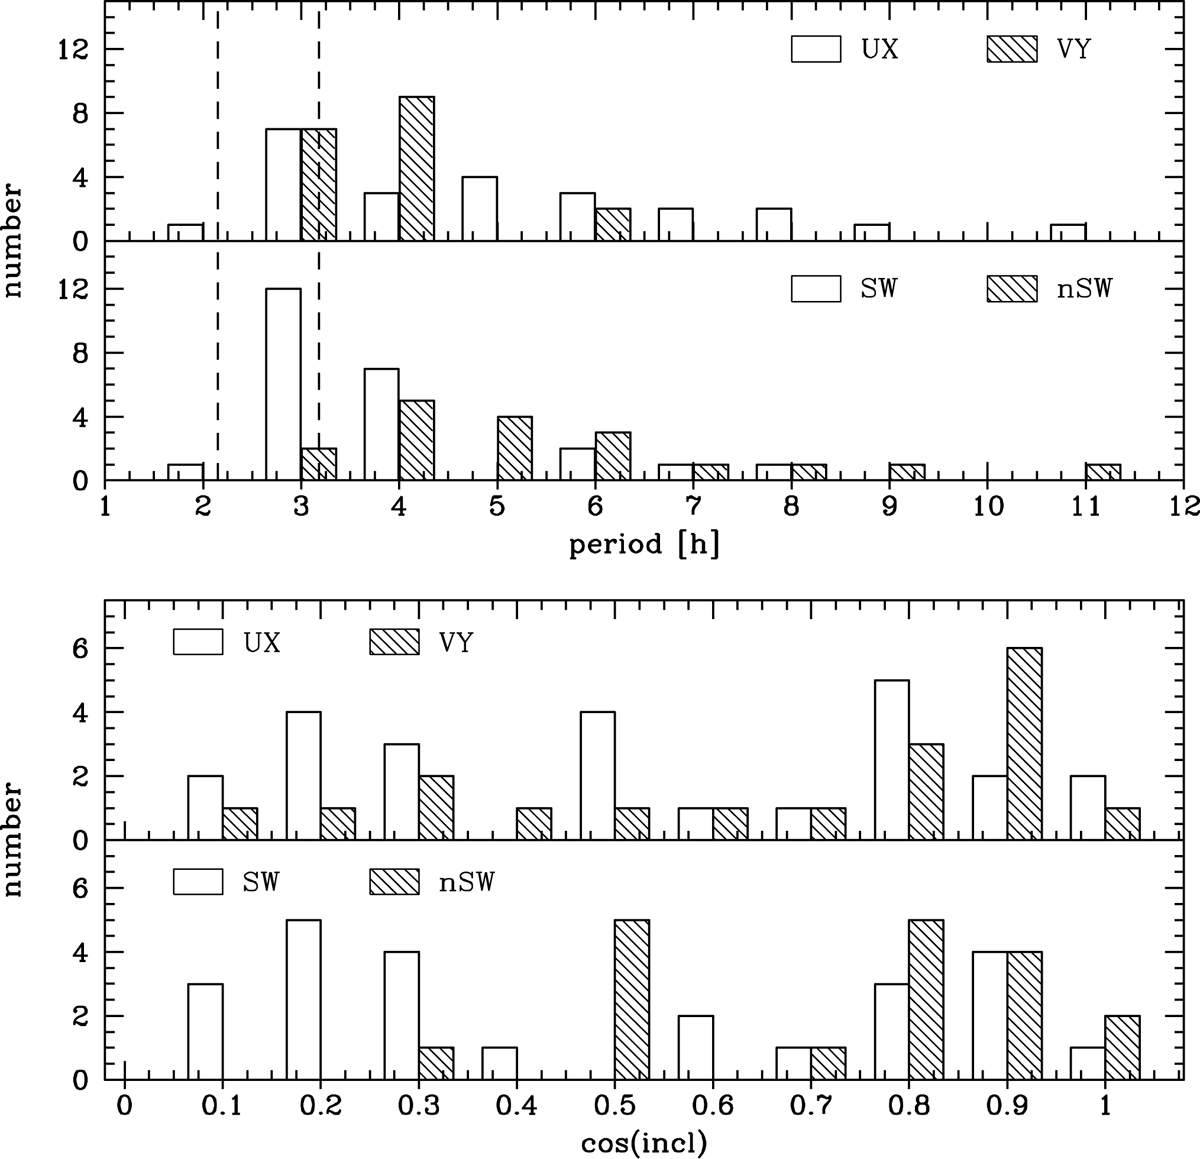
Fig. 1.
Download original image
Histograms of the periods (above) and inclinations (below) of the NLs in this paper, according to their class(es). The period gap (Knigge 2006) is indicated in the upper panel. Note that in the two panels of each figure the NLs are the same, but divided according to their class. To avoid confusion the histogram bins for each pair of classes have been plotted on either side of the central values, with sizes that avoided contact between adjacent bins.
Current usage metrics show cumulative count of Article Views (full-text article views including HTML views, PDF and ePub downloads, according to the available data) and Abstracts Views on Vision4Press platform.
Data correspond to usage on the plateform after 2015. The current usage metrics is available 48-96 hours after online publication and is updated daily on week days.
Initial download of the metrics may take a while.