| Issue |
A&A
Volume 680, December 2023
|
|
|---|---|---|
| Article Number | L14 | |
| Number of page(s) | 4 | |
| Section | Letters to the Editor | |
| DOI | https://doi.org/10.1051/0004-6361/202348449 | |
| Published online | 15 December 2023 | |
Letter to the Editor
The possible evolution of pitch angles of spiral galaxies
1
St. Petersburg State University, Universitetskii pr. 28, St. Petersburg 198504, Russia
e-mail: This email address is being protected from spambots. You need JavaScript enabled to view it.
2
Pulkovo Astronomical Observatory, Russian Academy of Sciences, St. Petersburg 196140, Russia
3
Department of Physics and Astronomy, N283 ESC, Brigham Young University, Provo, UT 84602, USA
Received:
31
October
2023
Accepted:
21
November
2023
Abstract
Aims. The origin and maintenance of spiral structure in galaxies, the correlation between different types of spiral structure and several proposed mechanisms for their generation, and the evolution of spiral arms of galaxies with time are questions that are still controversial. In this note we study the spiral structure in a sample of distant galaxies in order to infer the evolution of spiral arm characteristics with redshift.
Methods. We considered a sample of 171 face-on spiral galaxies in the Hubble Space Telescope COSMOS (The Cosmic Evolution Survey) field. The galaxies are distributed up to z ≈ 1 with a mean value of 0.44. For all galaxies, we determined the pitch angles of the spiral arms and analysed their dependence on redshift; a total of 359 arms were measured.
Results. Analyses of our measurements combined with the literature data suggest a possible evolution of the pitch angles of spiral galaxies: by the modern epoch the spiral pattern, on average, becomes more tightly wound. This may be a consequence of the general evolution of the structure of galaxies as galaxies become more massive over time and their bulges grow. In addition, the distribution of the cotangent of pitch angle of galaxies indicates the possibility that the dominant mechanism of spiral pattern generation changes over time.
Key words: galaxies: evolution / galaxies: spiral / galaxies: structure
© The Authors 2023
 Open Access article, published by EDP Sciences, under the terms of the Creative Commons Attribution License (https://creativecommons.org/licenses/by/4.0), which permits unrestricted use, distribution, and reproduction in any medium, provided the original work is properly cited.
This article is published in open access under the Subscribe to Open model. This email address is being protected from spambots. You need JavaScript enabled to view it. to support open access publication.
1. Introduction
Spiral structure is the most prominent and longest recognized (e.g., Rosse 1850) distinctive feature of the galaxies around us. Spiral arms shape what a galaxy looks like, so they are traditionally used to morphologically classify galaxies (Hubble 1926). A spiral pattern is present in most nearby massive galaxies (e.g., Nair & Abraham 2010; Willett et al. 2013), although the mechanisms through which these spiral structures originate and evolve are still debated (e.g., Dobbs & Baba 2014). It appears that the nature and dominant formation mechanisms of spiral arms may vary from one galaxy to another.
A substantial amount of observational data on the structure of spiral arms in nearby galaxies has now been accumulated (see discussion and references in Sellwood & Masters 2022). On the other hand, systematic studies of the spiral pattern in distant galaxies are still very rare (e.g., Savchenko & Reshetnikov 2011; Davis et al. 2012; Martínez-García et al. 2023). Elmegreen & Elmegreen (2014) showed that all types of spiral patterns known in the nearby Universe (grand-design, flocculent, and multiple arms) are present at z ≥ 1. Galaxies with pronounced spiral arms are also occasionally detected at high redshifts, for instance z = 2.54 (Yuan et al. 2017), z = 3.06 (Wu et al. 2023), and z = 4.41 (Tsukui & Iguchi 2021). Recent studies suggest that high z may be dominated by disc galaxies (e.g., Ferreira et al. 2023). This suggests that spiral pattern in distant galaxies may be quite common.
In our previous work (Reshetnikov & Marchuk 2022, hereafter Paper I), we present the results of determining the spiral arm pitch angles for 102 galaxies with a two-armed pattern in the Hubble Space Telescope (HST) Cosmic Evolution Survey (COSMOS) field. We found a weak but distinct tendency for the pitch angle to decrease as we approach the present-day epoch. Furthermore, our analysis using the Pringle-Dobbs test (Pringle & Dobbs 2019) showed that the predominant mechanisms of spiral arm formation can change over time (Paper I). In this note we almost double the number of distant galaxies studied and present the results of exploring the possible evolution of spiral pattern of galaxies with time.
Throughout this article we adopt a standard flat ΛCDM cosmology with Ωm = 0.3, ΩΛ = 0.7, and H0 = 70 km s−1 Mpc−1.
2. Sample and data reduction
Galaxies for this study were selected from the HST/Advanced Camera for Surveys COSMOS field. This survey covers almost 2 deg2 and provides deep and high-resolution F814W imaging data (Koekemoer et al. 2007). As in Paper I, to select objects with spiral arms we used the same sample comprising 26 113 bright ( ) galaxies in the COSMOS field presented by Mandelbaum et al. (2012). In the first step the apparent flattenings (b/a) were determined for each galaxy using the SEXTRACTOR package (Bertin & Arnouts 1996) and galaxies with b/a > 0.7 were selected. Based on careful visual inspection, a final sample was then selected consisting of 171 galaxies with clearly discernible and measurable spiral branches; the pixel size of the images is
  . The mean axial ratio of the galaxies in the final sample is ⟨b/a⟩ = 0.87 ± 0.06. In the following we assume that all galaxies are seen exactly face-on and do not use any correction for the possible inclination effect.
The sample objects were identified with the COSMOS2020 catalogue (Weaver et al. 2022). For each galaxy, we adopted the photometric redshift and stellar mass found with the LePhare code (Ilbert et al. 2006). Figure 1 illustrates the main characteristics of the sample: galaxies are distributed up to z ≈ 1 (mean redshift ⟨z⟩ = 0.44 ± 0.23); galaxy stellar masses are contained within 9.5 ≤ log M*/M⊙ ≤ 11.5 with a mean value of 10.53 ± 0.43.
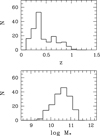 |
Fig. 1. Distributions of redshift (top) and stellar mass in solar units (bottom) for the sample galaxies. |
The procedure for measuring the pitch angles of spiral arms was the same as in Paper I (see also Savchenko et al. 2020). The number of measured arms in one galaxy varied from 1 to 5:29 galaxies with 1 measured arm, 104 with 2 arms, 31 with 3 arms, 6 with 4 arms, and 1 with 5 arms (see examples in Fig. 2). In total, we determined the pitch angles of 359 arms in 171 galaxies.
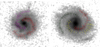 |
Fig. 2. Examples of galaxies from the sample with measured spirals (left: RA = 150.540631 Dec = 2.169663, z = 0.31; right: RA = 150.500902 Dec = 2.611881, z = 0.38; see Weaver et al. 2022). The dots give the positions of the brightness peaks; the segments correspond to the spiral half-width. |
The mean pitch angle of all measured arms is  ; the same value for massive galaxies with log M*/M⊙ ≥ 10.5 is
  (214 arms). The mean error of the pitch angle measurement is
  (see also Fig. 4 in Paper I). Within the observed scatter of the pitch angles there is no statistically significant difference in the mean ψ values for galaxies with different numbers of spiral arms. As seen in Fig. 3, the angles of galaxies at z ≤ 1, similar to nearby objects (e.g., Yu & Ho 2020), are distributed mainly within ψ ≤ 40°.
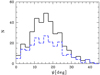 |
Fig. 3. Distribution of spiral arm pitch angle ψ for the sample galaxies (solid line). The dashed line shows the distribution for massive galaxies with log M*/M⊙ ≥ 10.5. |
3. Pitch angle evolution
3.1. ψ–z correlation
In Figs. 4a,b, we consider the dependence of the pitch angle of individual spiral arms on redshift. The scatter of the data is large, but a slight tendency, a weak trend, is apparent: as z increases, ψ increases as well. The correlations in Figs. 4a,b are weak (the coefficients of linear regression are about 0.2), but given the relatively large number of objects, they are significant at > 95%.
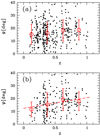 |
Fig. 4. Redshift dependence of pitch angle: (a) entire sample, (b) massive galaxies with log M*/M⊙ ≥ 10.5. The circles with bars give the mean values in redshift bins 0–0.25, 0.25–0.50, 0.50–0.75, 0.75–1. The dashed line is the linear regression for massive spiral galaxies: |

We point out that the pitch angles of galaxies are measured with errors. They show natural variations with radius (e.g., Savchenko & Reshetnikov 2013) and, in addition, different arms in the same galaxy may have different average pitch angles (e.g., Savchenko et al. 2020; Paper I). Therefore, the question arises of how strong the correlation with the pitch angle can be if it is determined with a large (∼50%) error.
To illustrate the effect of errors on the observed correlation, we performed a simple numerical experiment. We considered a pure linear dependence (the coefficient of linear correlation is 1.0) of two independent variables. The number of points was taken as equal to the number of spiral arms measured in our sample (N = 359). Then, a random error distributed according to the normal law was introduced into one of the variables, with the dispersion equal to 50% of the mean value of the variable, and the linear regression coefficient of such an artificially noisy dependence was measured again. After performing this operation many times, we obtained that after the introduction of errors, the correlation coefficient decreased to about 0.75. For the linear correlation coefficient to be equal to 0.2, as in our sample, the correlation coefficient of the original, unnoised dependence should be 0.4–0.5. We note that if the error is not normally distributed, the reduction in the observed correlation may be even stronger. Thus, we can conclude that the current data on the pitch angles of distant galaxies do not contradict the existence of a moderate dependence of ψ on redshift.
3.2. The Pringle–Dobbs test
For transient and recurrent spiral arms, and for tidal spiral arms, Pringle & Dobbs (2019) proposed that, under some simple assumptions, the pitch angle ψ decrease systematically with time t as cot ψ ∝ t. This assumption is consistent with numerical simulations of both the transient and the tidal arms (e.g., Grand et al. 2013; Pettitt & Wadsley 2018). This means that if we observe a random sample of galaxies at any fixed time, we expect to see a uniform distribution of cot ψ values. Application of this test to nearby galaxies showed that the distribution of cot ψ values is indeed close to uniform (Pringle & Dobbs 2019; Lingard et al. 2021).
Figure 5 illustrates the Pringle–Dobs test for massive spirals in three redshift bins. The sizes of the bins were chosen to correspond to approximately the same step in time Δt = 2.6 Gyr. In the first bin (z ≤ 0.22) there are few galaxies, and they show an almost flat distribution (see also Fig. 7 in Paper I). The statistics are small, but not inconsistent with the results of Pringle & Dobbs (2019) and Lingard et al. (2021) for nearby spiral galaxies. In the second bin (z = 0.22 − 0.52), the galaxies are much more numerous and show a broad and relatively flat distribution. In the more distant galaxies (z = 0.52 − 1.00) the appearance of the distribution changes: the right wing is suppressed; cot ψ shows a pronounced single peak at cot ψ ≈ 2.5 (ψ ≈ 22°). This change in the type of the distribution may reflect a change in the dominant mechanism of the generation and maintenance of spiral pattern in different epochs.
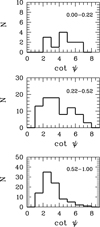 |
Fig. 5. Distributions of cot ψ for the spiral arms of massive galaxies (log M*/M⊙ ≥ 10.5) in different redshift bins. |
3.3. Pitch angles of most distant galaxies
We now consider how the trend shown in Fig. 4 agrees with observations of high-redshift galaxies. Unfortunately, the data on the pitch angles of the spiral arms of distant galaxies are very sparse to date. Figure 6 shows the characteristics of spiral pattern of four galaxies with z > 2. These objects are as follows:
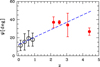 |
Fig. 6. Dependence of pitch angle of spiral galaxies on redshift. The open cirles depict mean values for the COSMOS spirals (see Fig. 4b); the solid circles are the individual measurements for several distant galaxies (see text). The dashed line shows an extrapolation of the linear regression from Fig. 4b to high redshifts. |
Q2343-BX442, z = 2.18, ψ = 37 ° ±6° (Law et al. 2012);
A1689B11, z = 2.54, ψ = 37 ° ±2° (Yuan et al. 2017);
A2744-DSG-z3, z = 3.06, ψ = 34 ° ±13° (Wu et al. 2023);
BRI 1335-0417, z = 4.41,  (Tsukui & Iguchi 2021).
As can be seen in Fig. 6, the pitch angles of distant galaxies exceed the values for nearby objects and, in general, they agree with the observational trend noted in Fig. 4. The statistics of distant objects are, of course, exceptionally poor, so Fig. 6 merely characterises the current state of affairs with measurements of spirals at z > 2.
4. Conclusions
In this note we have presented the results of determining the pitch angles of the spiral arms in 171 spiral galaxies up to z ≈ 1 in the HST COSMOS field. Our measurements were performed in the F814W filter, which approximately corresponds to the rest-frame V filter at the mean redshift of the sample.
Based on our data, and using literature data on the structure of the most distant galaxies with spiral pattern measurements, we conclude that there may be an evolution in the shape of spiral arms with time. As we approach the modern epoch, spiral arms, on average, become more tightly wound. The amplitude of the effect is small and corresponds to ∼1°/Gyr at z ≤ 1.
Tidal spirals and recurrent transient spiral instabilities, driven by self-gravity, evolve with time such that the pitch angle of the spiral pattern decreases (e.g., Grand et al. 2013; Semczuk et al. 2017; Pettitt & Wadsley 2018). However, this twisting occurs on a much smaller timescale and with greater amplitude. In our Letter we discuss the longer overall evolution of the pitch angle.
A possible reason for the observed long-term evolution of the spiral pitch angle may be the evolution of the global structure of galaxies. Over time, galaxies become more massive, their concentration towards the centre rises, and bulges become progressively brighter. More than half of the current stellar mass of the bulges is gained at z ≲ 1 (Sachdeva et al. 2017). On the other hand, a number of studies have shown that the pitch angle correlates with the mass of the galaxy and the characteristics of its bulge (e.g., Savchenko & Reshetnikov 2013; Yu & Ho 2019, 2020). Consequently, the change in the structure of evolving galaxies should be accompanied by a gradual change in the shape of the forming spiral arms. In addition, the effects of observational selection, cosmological surface brightness dimming, and k-correction can all influence the observed correlation.
For objects at different redshifts, we considered a distribution of cot ψ. Within the current relatively sparse statistics we can tentatively conclude that at z < 0.5 the shape of the cot ψ distribution changes (see also Paper I). This may indicate that the dominant mechanism for generating and maintaining the spiral pattern changed during that epoch (about 5 Gyr ago) and the surrounding part of the Universe is dominated by transient and recurrent spiral arms driven by self-gravity (Pringle & Dobbs 2019; Lingard et al. 2021).
The results of this work are based on the Hubble Space Telescope imaging data. The James Webb Space Telescope (JWST) significantly outperforms the HST in its ability to highlight spiral structure in distant and faint galaxies (see e.g., Fig. 14 in Ferreira et al. 2023). Therefore, future observations with the JWST will hopefully clarify the issues discussed in this note.
Acknowledgments
This work was supported by the Russian Science Foundation (project no. 22-22-00483).
References
- Bertin, E., & Arnouts, S. 1996, A&AS, 117, 393 [NASA ADS] [CrossRef] [EDP Sciences] [Google Scholar]
- Davis, B. L., Berrier, J. C., Shields, D. W., et al. 2012, ApJS, 199, 33 [NASA ADS] [CrossRef] [Google Scholar]
- Dobbs, C., & Baba, J. 2014, PASA, 31, e035 [NASA ADS] [CrossRef] [Google Scholar]
- Elmegreen, D. M., & Elmegreen, B. G. 2014, ApJ, 781, 11 [Google Scholar]
- Ferreira, L., Conselice, Ch. J., Sazonova, E., et al. 2023, ApJ, 955, 94 [NASA ADS] [CrossRef] [Google Scholar]
- Grand, R. J. J., Kawata, D., & Cropper, M. 2013, A&A, 553, A77 [NASA ADS] [CrossRef] [EDP Sciences] [Google Scholar]
- Hubble, E. 1926, ApJ, 64, 321 [NASA ADS] [CrossRef] [Google Scholar]
- Ilbert, O., Arnouts, S., McCraken, H. J., et al. 2006, A&A, 457, 841 [NASA ADS] [CrossRef] [EDP Sciences] [Google Scholar]
- Koekemoer, A. M., Aussel, H., Calzetti, D., et al. 2007, ApJS, 172, 196 [Google Scholar]
- Law, D. R., Shapley, A. E., Steidel, Ch. C., et al. 2012, Nature, 7407, 338 [NASA ADS] [CrossRef] [Google Scholar]
- Lingard, T., Masters, K. L., Krawczyk, C., et al. 2021, MNRAS, 504, 3364 [NASA ADS] [CrossRef] [Google Scholar]
- Mandelbaum, R., Hirata, C. M., Leauthaud, A., Massey, R. J., & Rhodes, J. 2012, MNRAS, 420, 1518 [NASA ADS] [CrossRef] [Google Scholar]
- Martínez-García, E. E., González-Lópezlira, R. A., & Puerari, I. 2023, MNRAS, 524, 18 [CrossRef] [Google Scholar]
- Nair, P. B., & Abraham, R. G. 2010, ApJS, 186, 427 [Google Scholar]
- Pettitt, A. R., & Wadsley, J. W. 2018, MNRAS, 474, 5645 [NASA ADS] [CrossRef] [Google Scholar]
- Pringle, J. E., & Dobbs, C. L. 2019, MNRAS, 490, 1470 [NASA ADS] [CrossRef] [Google Scholar]
- Reshetnikov, V. P., Marchuk, A. A., Chugunov, I. V., et al. 2022, Astron. Lett., 48, 636 (Paper I) [Google Scholar]
- Rosse, E. 1850, Philos. Trans. R. Soc. London, 140, 499 [NASA ADS] [CrossRef] [Google Scholar]
- Sachdeva, S., Saha, K., & Singh, H. 2017, ApJ, 840, 79 [NASA ADS] [CrossRef] [Google Scholar]
- Savchenko, S. S., & Reshetnikov, V. P. 2011, Astron. Lett., 37, 817 [NASA ADS] [CrossRef] [Google Scholar]
- Savchenko, S. S., & Reshetnikov, V. P. 2013, MNRAS, 436, 1074 [CrossRef] [Google Scholar]
- Savchenko, S., Marchuk, A., Mosenkov, A., & Grishunin, K. 2020, MNRAS, 493, 390 [NASA ADS] [CrossRef] [Google Scholar]
- Sellwood, J. A., & Masters, K. L. 2022, ARA&A, 60, 73 [NASA ADS] [CrossRef] [Google Scholar]
- Semczuk, M., Łokas, E. L., & del Pino, A. 2017, ApJ, 834, 7 [Google Scholar]
- Tsukui, T., & Iguchi, S. 2021, Science, 372, 1201 [NASA ADS] [CrossRef] [Google Scholar]
- Weaver, J. R., Kauffmann, O. B., Ilbert, O., et al. 2022, ApJS, 258, 11 [NASA ADS] [CrossRef] [Google Scholar]
- Willett, K. W., Lintott, Ch. J., Bamford, S. P., et al. 2013, MNRAS, 435, 2835 [CrossRef] [Google Scholar]
- Wu, Y., Cai, Z., Sun, F., et al. 2023, ApJ, 942, L1 [CrossRef] [Google Scholar]
- Yuan, T., Richard, J., Gupta, A., et al. 2017, ApJ, 850, 61 [NASA ADS] [CrossRef] [Google Scholar]
- Yu, S.-Y., & Ho, L. C. 2019, ApJ, 871, 194 [NASA ADS] [CrossRef] [Google Scholar]
- Yu, S.-Y., & Ho, L. C. 2020, ApJ, 900, 150 [NASA ADS] [CrossRef] [Google Scholar]
All Figures
|
Fig. 1. Distributions of redshift (top) and stellar mass in solar units (bottom) for the sample galaxies. |
| In the text | |
|
Fig. 2. Examples of galaxies from the sample with measured spirals (left: RA = 150.540631 Dec = 2.169663, z = 0.31; right: RA = 150.500902 Dec = 2.611881, z = 0.38; see Weaver et al. 2022). The dots give the positions of the brightness peaks; the segments correspond to the spiral half-width. |
| In the text | |
|
Fig. 3. Distribution of spiral arm pitch angle ψ for the sample galaxies (solid line). The dashed line shows the distribution for massive galaxies with log M*/M⊙ ≥ 10.5. |
| In the text | |
|
Fig. 4. Redshift dependence of pitch angle: (a) entire sample, (b) massive galaxies with log M*/M⊙ ≥ 10.5. The circles with bars give the mean values in redshift bins 0–0.25, 0.25–0.50, 0.50–0.75, 0.75–1. The dashed line is the linear regression for massive spiral galaxies: |
| In the text | |
|
Fig. 5. Distributions of cot ψ for the spiral arms of massive galaxies (log M*/M⊙ ≥ 10.5) in different redshift bins. |
| In the text | |
|
Fig. 6. Dependence of pitch angle of spiral galaxies on redshift. The open cirles depict mean values for the COSMOS spirals (see Fig. 4b); the solid circles are the individual measurements for several distant galaxies (see text). The dashed line shows an extrapolation of the linear regression from Fig. 4b to high redshifts. |
| In the text | |
Current usage metrics show cumulative count of Article Views (full-text article views including HTML views, PDF and ePub downloads, according to the available data) and Abstracts Views on Vision4Press platform.
Data correspond to usage on the plateform after 2015. The current usage metrics is available 48-96 hours after online publication and is updated daily on week days.
Initial download of the metrics may take a while.