Open Access
Fig. 2.
Download original image
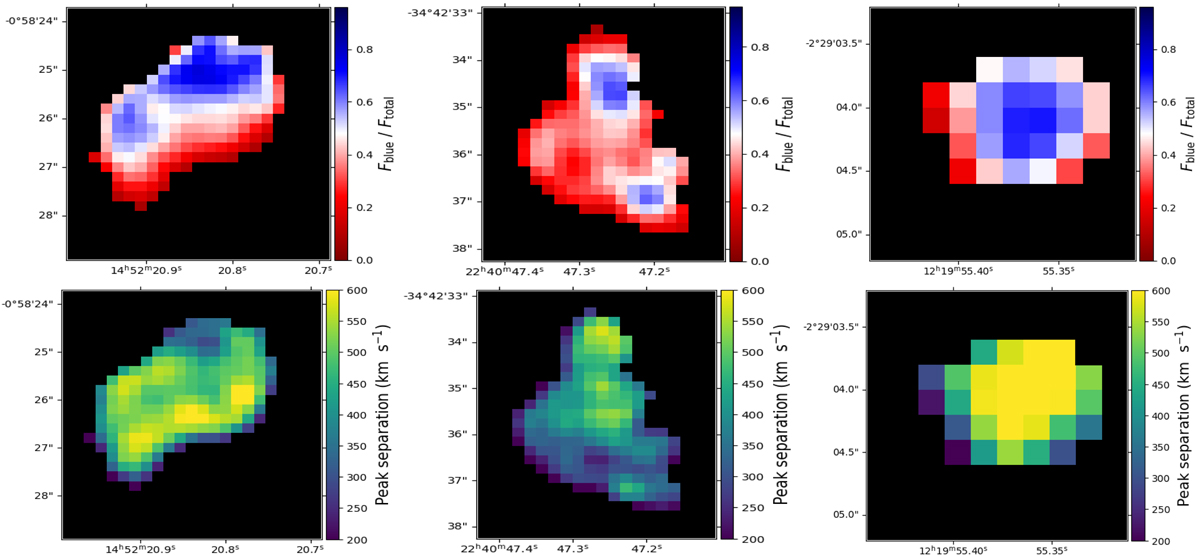
Flux-ratio and peak-separation maps: Top row: pixel by pixel map color-coded according to blue-to-total flux ratio. Bottom row: peak separation map. These are arranged from left to right in increasing order of redshift (z = 2.9, 3.6, and 4.8). Peak separation maps are scaled within the range of 200 − 600 km s−1.
Current usage metrics show cumulative count of Article Views (full-text article views including HTML views, PDF and ePub downloads, according to the available data) and Abstracts Views on Vision4Press platform.
Data correspond to usage on the plateform after 2015. The current usage metrics is available 48-96 hours after online publication and is updated daily on week days.
Initial download of the metrics may take a while.