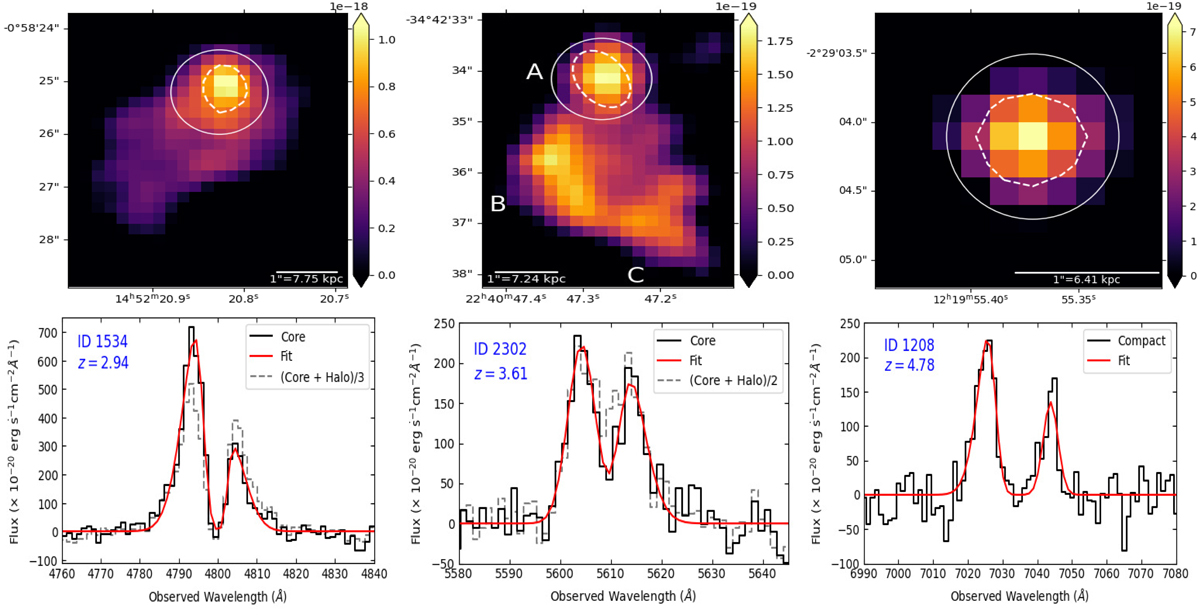
Fig. 1.
Download original image
Spatial and spectral profiles: shown are continuum-subtracted Lyα NB images smoothed with a 2D Gaussian Kernel of σ = 1 (top row) and a 1D Lyα emission profile fitted with a double-skewed Gaussian (bottom row). The 1D spectra of the cores for the sources at z = 2.9, 3.6, and 4.8 are extracted using 0.8″, 0.8″, and 0.6″ apertures (solid white circles in the NB images), respectively. These are shown in black solid lines in the bottom row. Dashed gray lines for the sources at z = 2.9 and z = 3.6 show the scaled Lyα spectra of the entire halo. The z = 4.8 LAE, which is a compact source, is covered in its entirety within the 0.6″ aperture. White dashed contours in the NBs indicate the position of the continuum. For the z = 3.6 LAE, three distinct regions are labeled as A, B, and C in the NB image. The colorbars are in units of erg s−1cm−2 pix−2 where 1 pix = 0.2″.
Current usage metrics show cumulative count of Article Views (full-text article views including HTML views, PDF and ePub downloads, according to the available data) and Abstracts Views on Vision4Press platform.
Data correspond to usage on the plateform after 2015. The current usage metrics is available 48-96 hours after online publication and is updated daily on week days.
Initial download of the metrics may take a while.