Open Access
Fig. 1.
Download original image
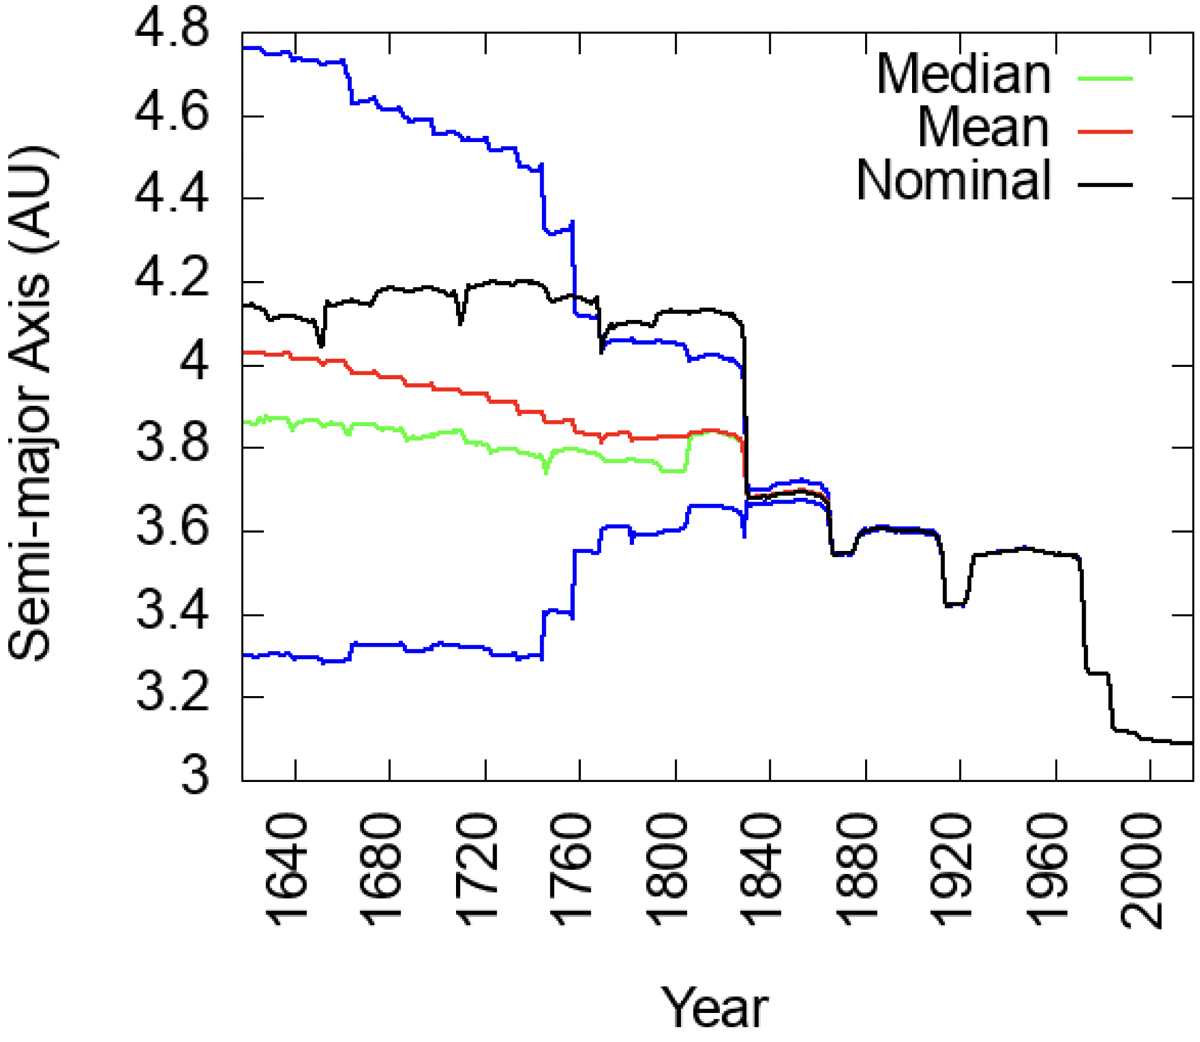
Time-evolution of the nominal (black), average (red) and median (green) orbital elements of 1000 clones of comet 46P/Wirtanen generated in 2018. The blue curve represents the one standard deviation range about the average orbital element. All comet clones follow a similar evolution until 1830.
Current usage metrics show cumulative count of Article Views (full-text article views including HTML views, PDF and ePub downloads, according to the available data) and Abstracts Views on Vision4Press platform.
Data correspond to usage on the plateform after 2015. The current usage metrics is available 48-96 hours after online publication and is updated daily on week days.
Initial download of the metrics may take a while.