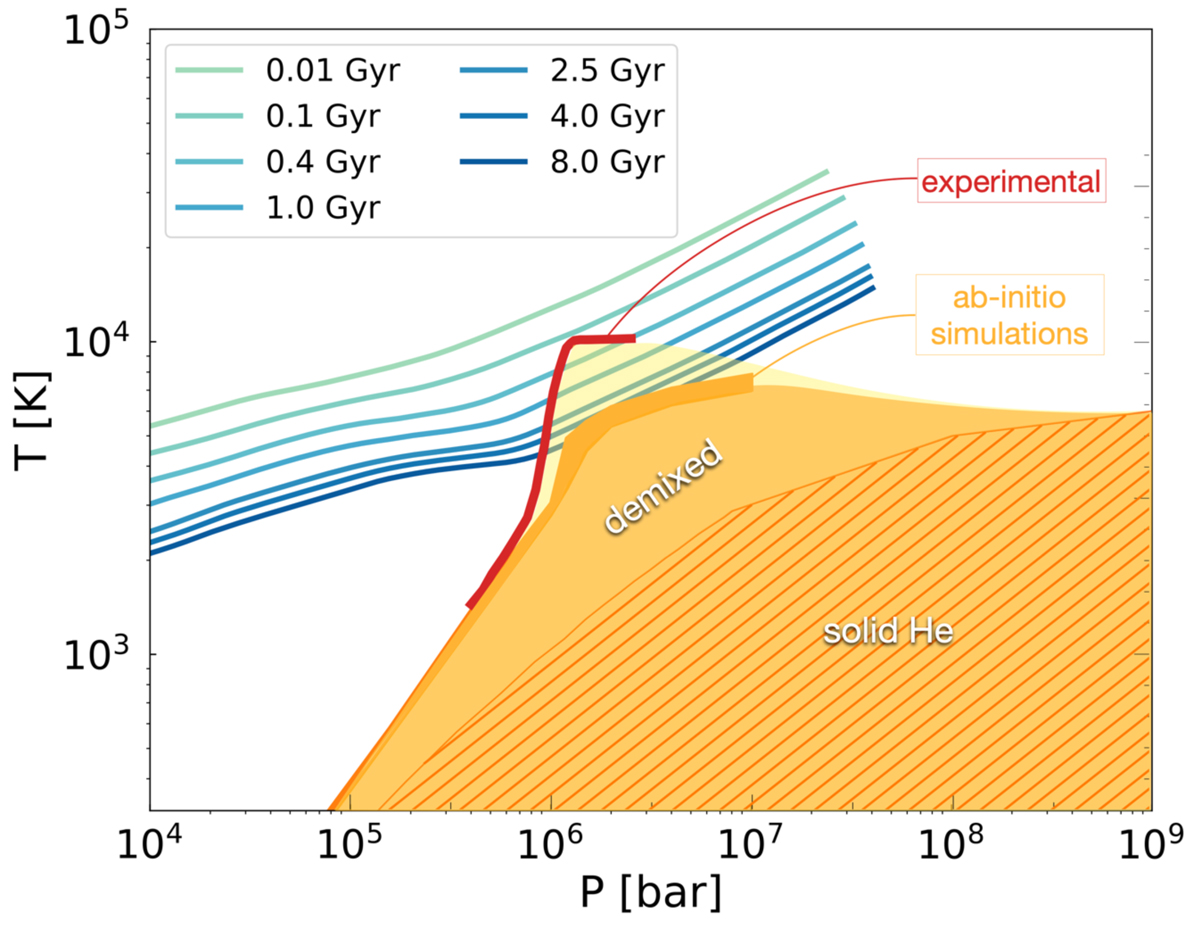
Fig. 4.
Download original image
Sequence in evolutionary time of Jupiter interior profiles (from 10 Myr to 8 Gyr) superimposed with a miscibility diagram of H–He. We show the immiscibility curve of experiments from Brygoo et al. (2021) in red and of ab initio simulations from Schöttler & Redmer (2018) in orange. The hashed region is where He becomes solid.
Current usage metrics show cumulative count of Article Views (full-text article views including HTML views, PDF and ePub downloads, according to the available data) and Abstracts Views on Vision4Press platform.
Data correspond to usage on the plateform after 2015. The current usage metrics is available 48-96 hours after online publication and is updated daily on week days.
Initial download of the metrics may take a while.