Open Access
Fig. F.1.
Download original image
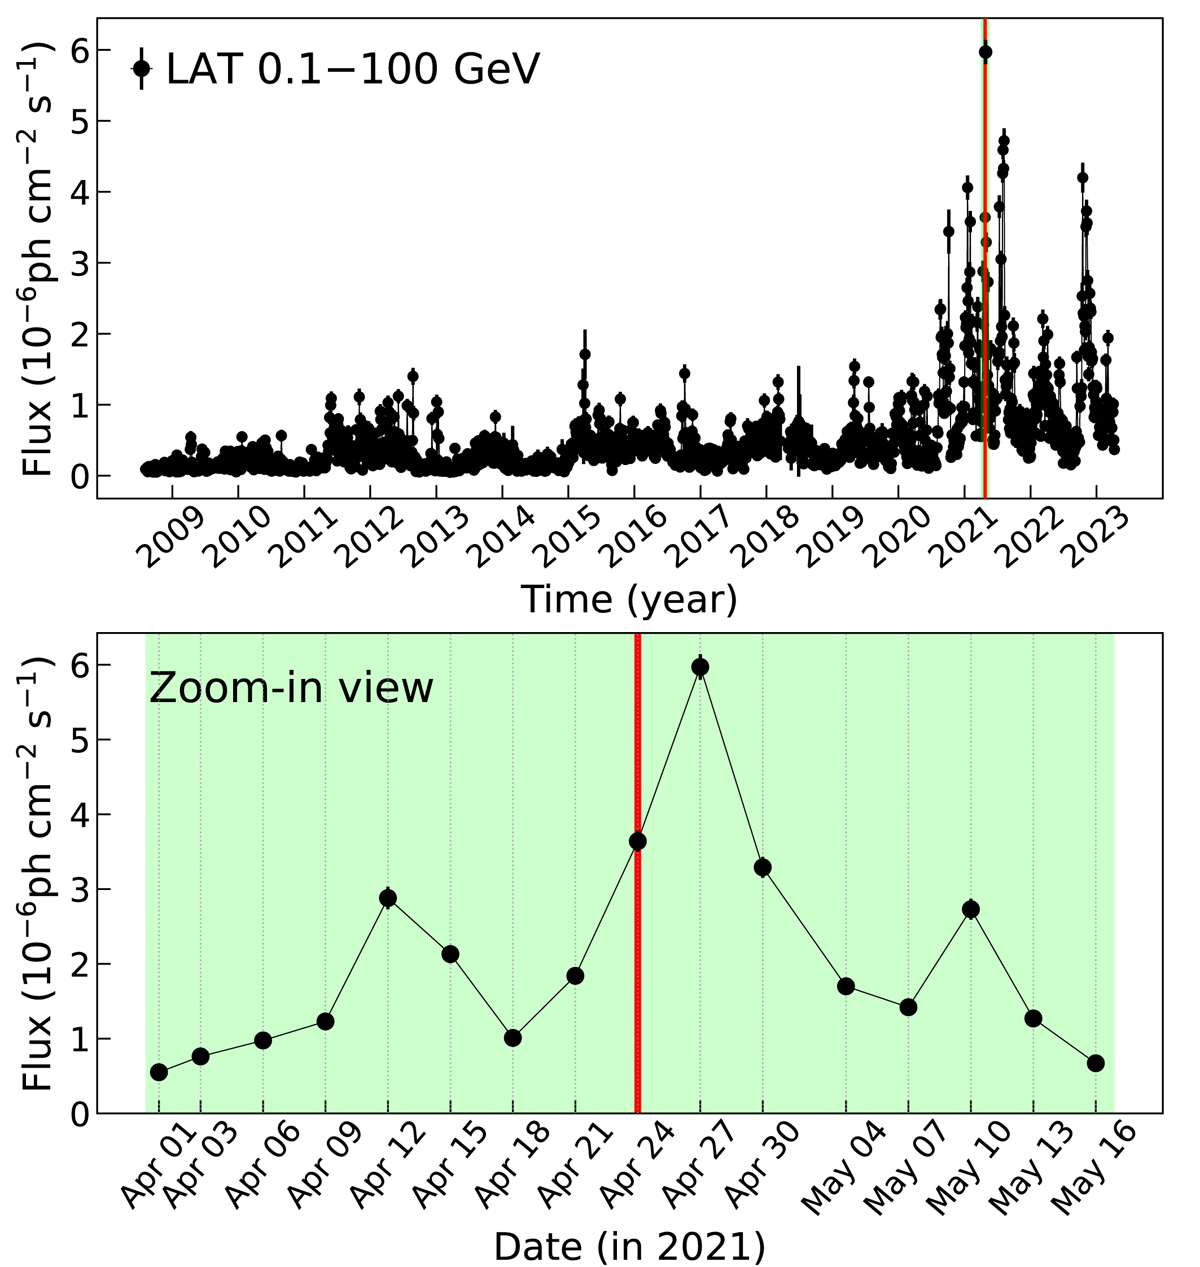
Long-term γ-ray light curve of BL Lac over 2009–2023 (top). Zoom-in view of the strongest flare is presented (bottom). The red vertical line denotes the observing date of the GMVA observation on 24 April 2021. The green shaded area shows a zoom-in view of the γ-rays near the GMVA observation.
Current usage metrics show cumulative count of Article Views (full-text article views including HTML views, PDF and ePub downloads, according to the available data) and Abstracts Views on Vision4Press platform.
Data correspond to usage on the plateform after 2015. The current usage metrics is available 48-96 hours after online publication and is updated daily on week days.
Initial download of the metrics may take a while.