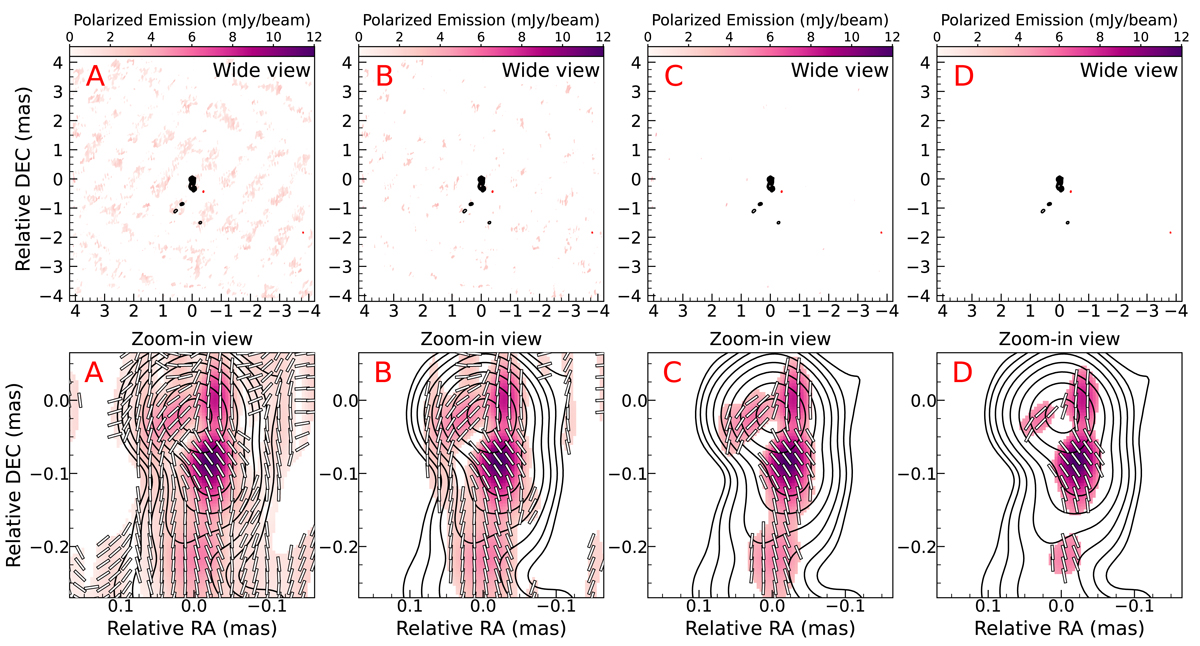
Fig. D.1.
Download original image
Linear polarization maps of the jet with uniform weighting. Different polarization cutoffs are applied to the maps: 1σP, rms for A, 3σP, rms for B, 5σP, rms for C, and 7σP, rms for D. For total intensity, 1σI, rms is used for all the maps. The contour lines represent total intensity increasing by a factor of 2 from 0.6 % to 76.8 % of the I-peak that is around ∼0.8 Jy. The red contour line represents −0.6 % of the I-peak. The polarized emission is shown with the color scale. The maps are convolved with a circular restoring beam of radius 0.07 mas. The white line segments denote EVPAs of the polarized emission.
Current usage metrics show cumulative count of Article Views (full-text article views including HTML views, PDF and ePub downloads, according to the available data) and Abstracts Views on Vision4Press platform.
Data correspond to usage on the plateform after 2015. The current usage metrics is available 48-96 hours after online publication and is updated daily on week days.
Initial download of the metrics may take a while.