Fig. 1.
Download original image
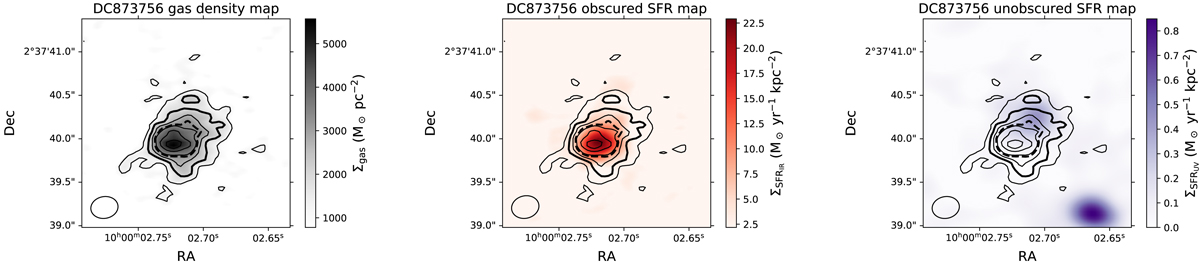
Surface density maps of DC873756: Gas (left, traced by [CII]), obscured FIR SFR (center, traced by the 158 μm rest-frame continuum), and unobscured UV SFR (right, traced by the F814W observer-frame continuum). The black contours are the (3+2k) σ levels (k ≥ 0) of the gas surface density. The thicker solid and dashed lines, respectively, are used to highlight the 5σΣgas limit and the border between the low- and high-density regions used in our analysis (see Sect. 3). The ALMA synthesized beam size is shown in the lower left corner. The unobscured SFR surface density map based on HST data is convolved by a Gaussian kernel to match the ALMA resolution.
Current usage metrics show cumulative count of Article Views (full-text article views including HTML views, PDF and ePub downloads, according to the available data) and Abstracts Views on Vision4Press platform.
Data correspond to usage on the plateform after 2015. The current usage metrics is available 48-96 hours after online publication and is updated daily on week days.
Initial download of the metrics may take a while.