Fig. 7.
Download original image
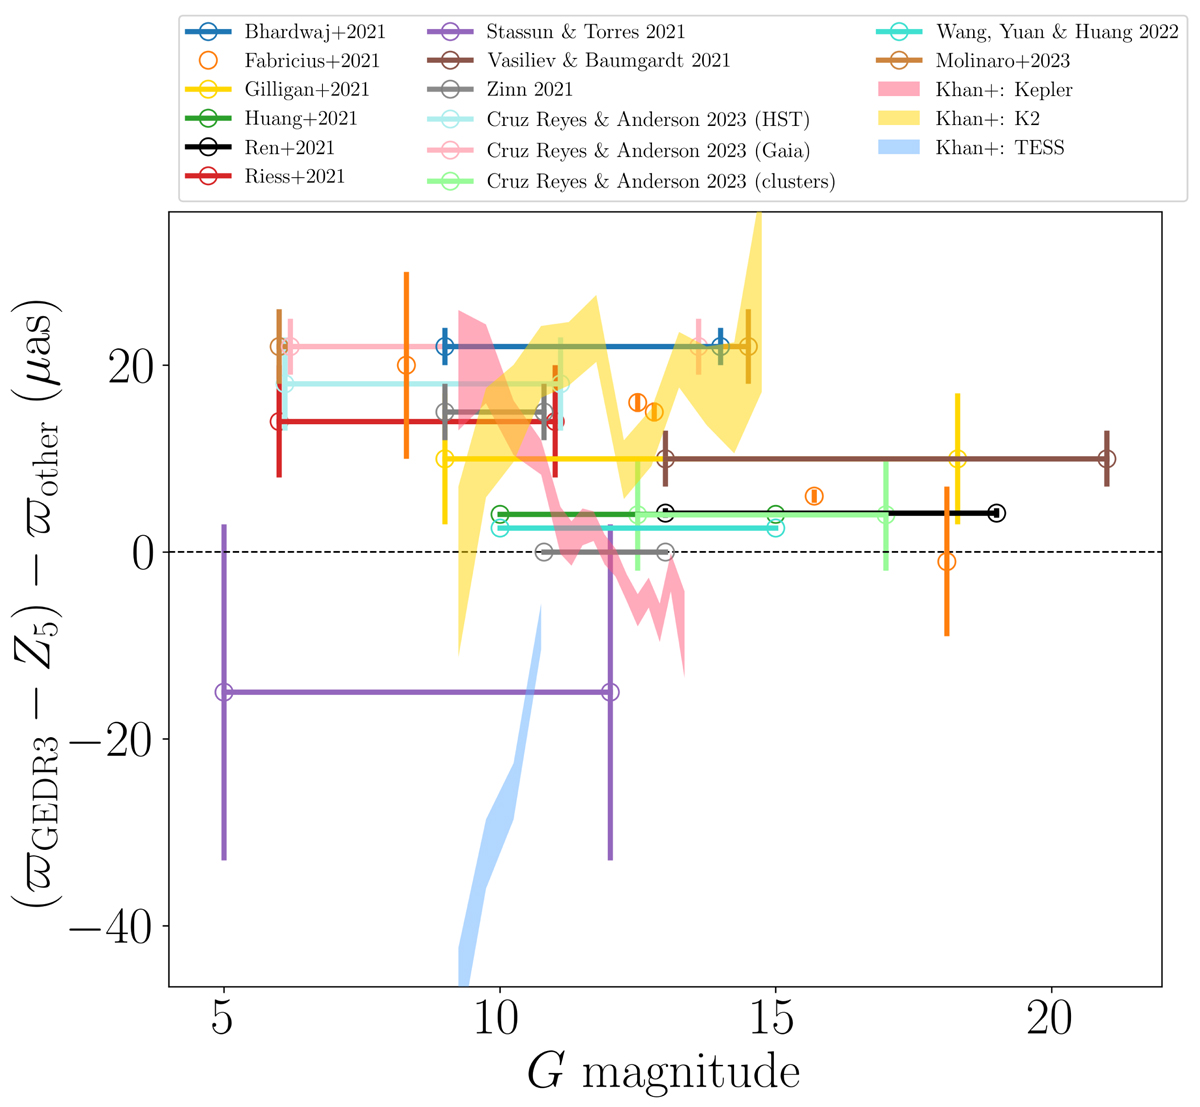
Comparison of our results, Δϖcorr = (ϖGEDR3 − Z5)−ϖPARAM, to a compilation of Gaia parallax offset residuals from the literature as a function of the magnitude in the G-band. Results displayed as open circles with vertical error bars are from the literature. Our findings for Kepler, K2, and TESS are shown as red, yellow, and blue shaded areas, respectively. Different literature sources used very astrophysically different objects and methods. Here we used the same methodology applied to a rather intrinsically homogeneous group of stars. The sign convention we use is such that positive values correspond to an overcorrection of parallaxes and negative values to an underestimation of parallaxes by L21.
Current usage metrics show cumulative count of Article Views (full-text article views including HTML views, PDF and ePub downloads, according to the available data) and Abstracts Views on Vision4Press platform.
Data correspond to usage on the plateform after 2015. The current usage metrics is available 48-96 hours after online publication and is updated daily on week days.
Initial download of the metrics may take a while.