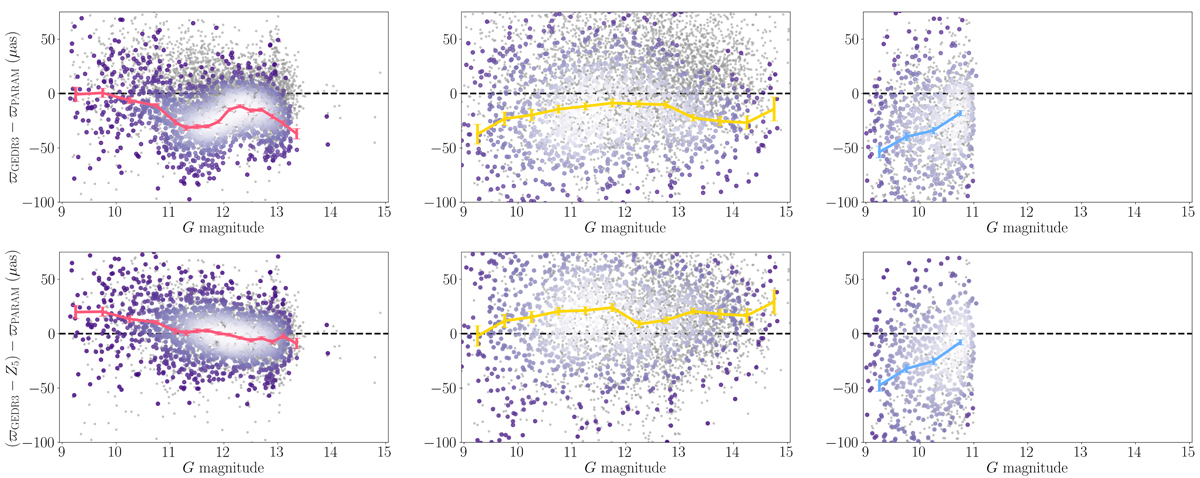
Fig. 5.
Download original image
Parallax difference before (top) and after correction (bottom) as a function of G magnitude for Kepler (left), K2 (middle), and TESS (right). The grey scatter corresponds to the entire sample of RGB and RC stars. Our best sample with low-extinction RC stars is shown with purple points, and the colour scale indicates their density (increasing from dark purple to white). The red, yellow, and blue lines show the running mean and its uncertainty for each field.
Current usage metrics show cumulative count of Article Views (full-text article views including HTML views, PDF and ePub downloads, according to the available data) and Abstracts Views on Vision4Press platform.
Data correspond to usage on the plateform after 2015. The current usage metrics is available 48-96 hours after online publication and is updated daily on week days.
Initial download of the metrics may take a while.