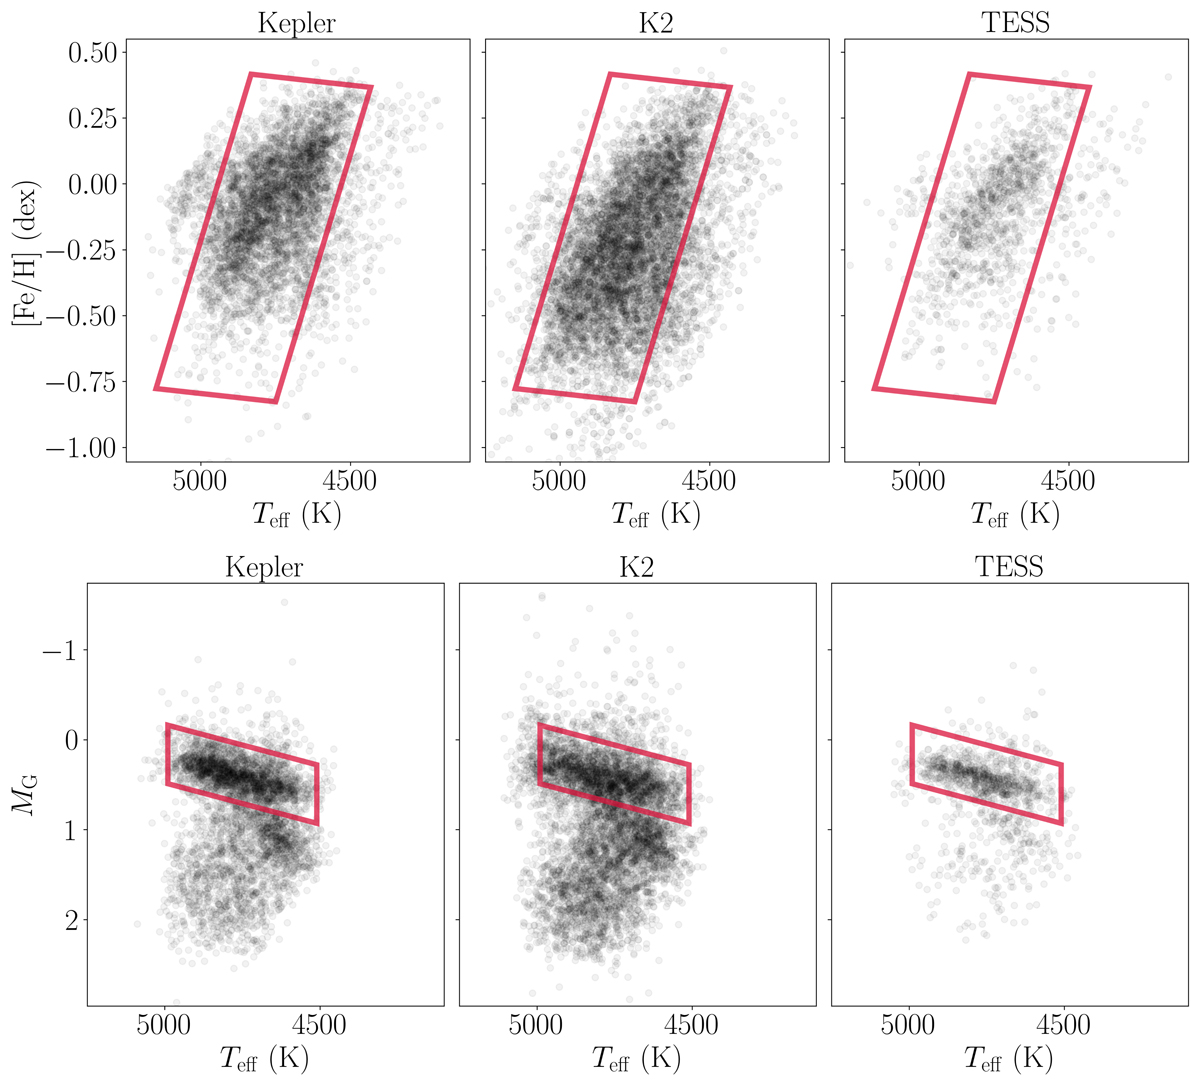
Fig. 1.
Download original image
Diagrams illustrating our two-step selection method to have a RC star population as homogeneous as possible among the Kepler (left), K2 (middle), and TESS-SCVZ fields (right) using E20 and APOGEE DR17. Top: Teff vs. [Fe/H] diagrams. The red box indicates the first selection of the bulk of the RGB and RC stars to make sure that our sample is chemically similar. Bottom: Hertzsprung–Russell diagrams (Teff vs. absolute magnitude from Gaia in the G-band) after the first selection was applied. We draw a region in the HRD to select RC stars (red rectangles).
Current usage metrics show cumulative count of Article Views (full-text article views including HTML views, PDF and ePub downloads, according to the available data) and Abstracts Views on Vision4Press platform.
Data correspond to usage on the plateform after 2015. The current usage metrics is available 48-96 hours after online publication and is updated daily on week days.
Initial download of the metrics may take a while.