Fig. 6.
Download original image
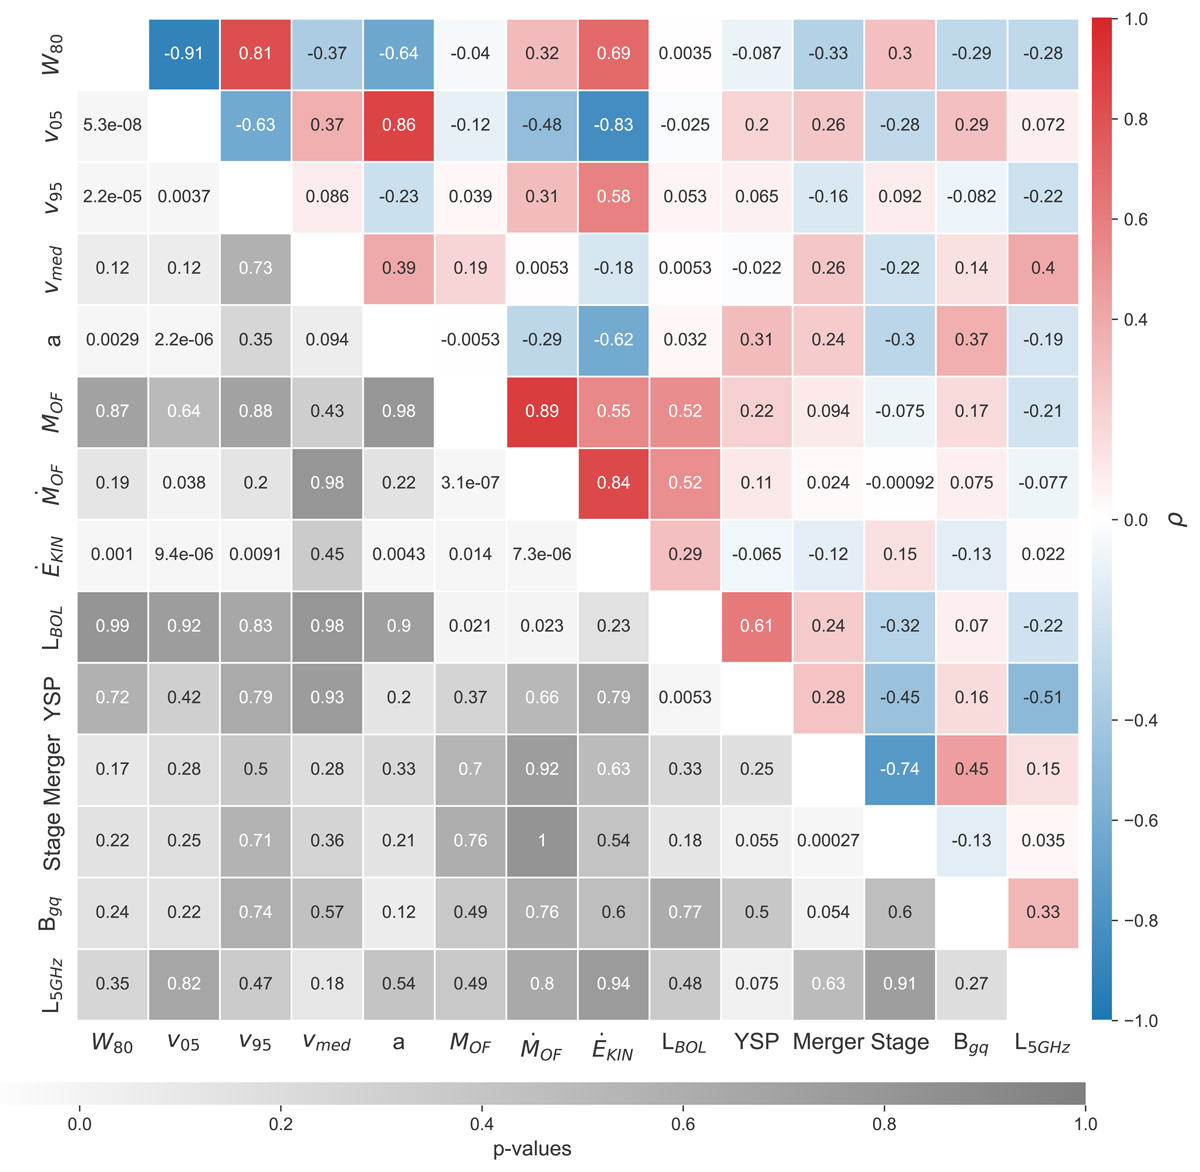
Correlation matrix between the QSO2 outflow properties derived from the [OIII] emission line and using the flux-weighted nonparametric method, and their AGN and host galaxies properties. The Spearman rank correlation coefficients (ρ) are shown in the top right half of the matrix (blue and red), and the corresponding p-values are plotted in the bottom left half (gray).
Current usage metrics show cumulative count of Article Views (full-text article views including HTML views, PDF and ePub downloads, according to the available data) and Abstracts Views on Vision4Press platform.
Data correspond to usage on the plateform after 2015. The current usage metrics is available 48-96 hours after online publication and is updated daily on week days.
Initial download of the metrics may take a while.