Fig. 3.
Download original image
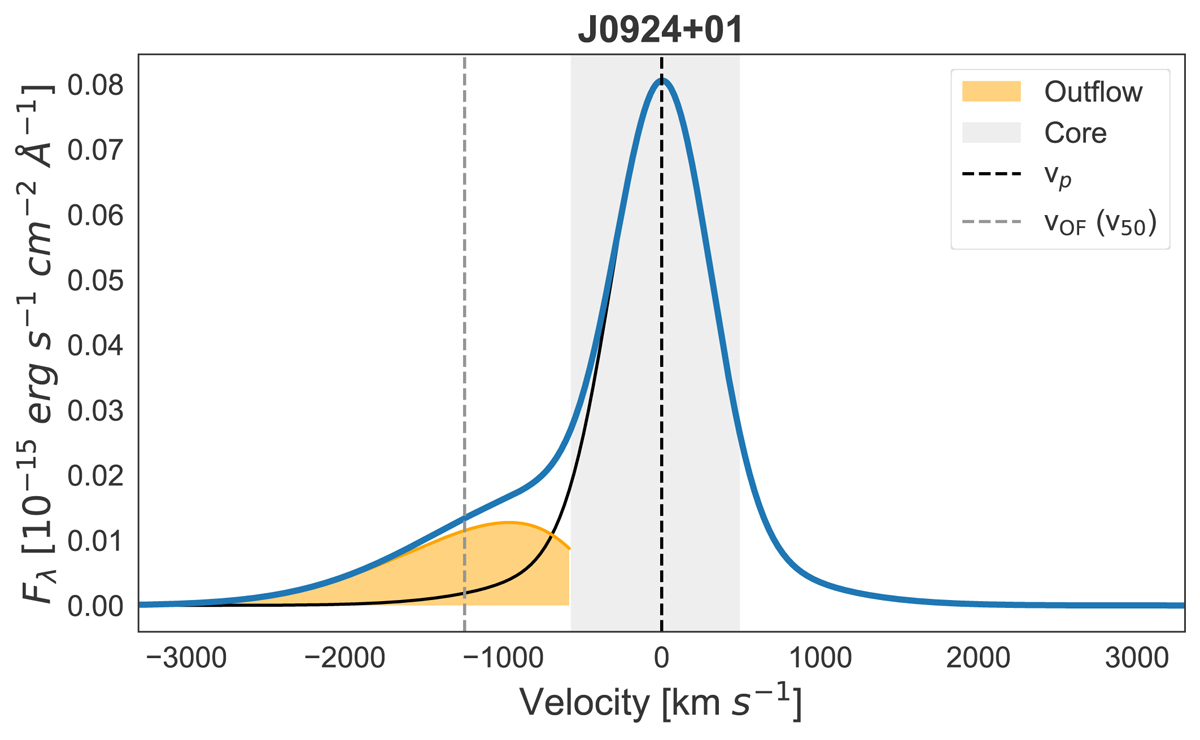
Same as in Fig. 2, but using the peak-weighted nonparametric method from Speranza et al. (2021). The solid black line on the blue side of the emission line corresponds to the mirror image of the red side. The gray area is the core of the line, defined as the region between the peak and one-third of the peak flux. The orange area is the result of subtracting the black from the blue line outside the core region, which is what we consider to be outflowing gas using this method. The vertical dashed black and gray lines are the peak and outflow velocities (vp and vOF).
Current usage metrics show cumulative count of Article Views (full-text article views including HTML views, PDF and ePub downloads, according to the available data) and Abstracts Views on Vision4Press platform.
Data correspond to usage on the plateform after 2015. The current usage metrics is available 48-96 hours after online publication and is updated daily on week days.
Initial download of the metrics may take a while.