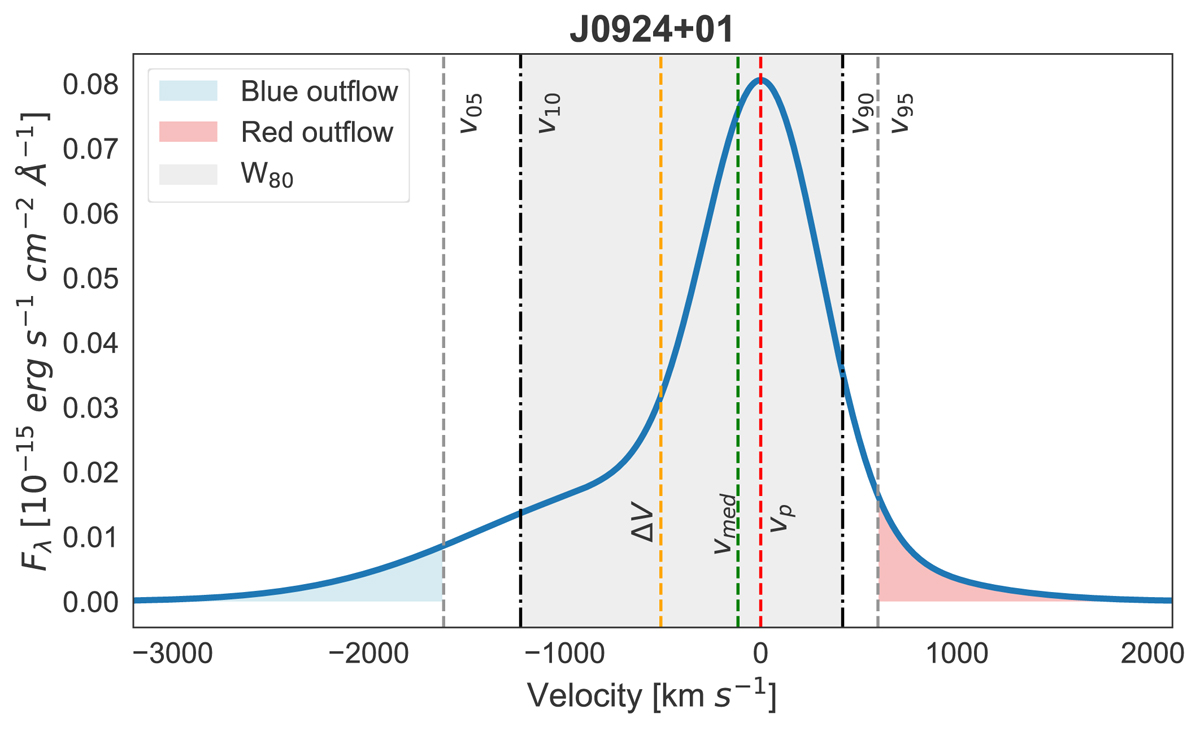
Fig. 2.
Download original image
Example of the flux-weighted nonparametric method. The solid blue line is the parametric fit to the [OIII]λ5007 Å emission line shown in Fig. 1 for J0924+01, without the continuum. The nonparametric velocity definitions included in this figure are the median velocity (vmed), the velocities at the 5, 10, 90, and 95% points of the normalized cumulative function of the emission line flux (v05, v10, v90, and v95), and the width of the line containing 80% of the total flux (W80 = v90 − v10). The gray region corresponds to the area containing 80% of the total flux (i.e., between v10 and v90), and the blue and red regions correspond to high-velocity gas, which we consider to be outflowing.
Current usage metrics show cumulative count of Article Views (full-text article views including HTML views, PDF and ePub downloads, according to the available data) and Abstracts Views on Vision4Press platform.
Data correspond to usage on the plateform after 2015. The current usage metrics is available 48-96 hours after online publication and is updated daily on week days.
Initial download of the metrics may take a while.