Fig. 7
Download original image
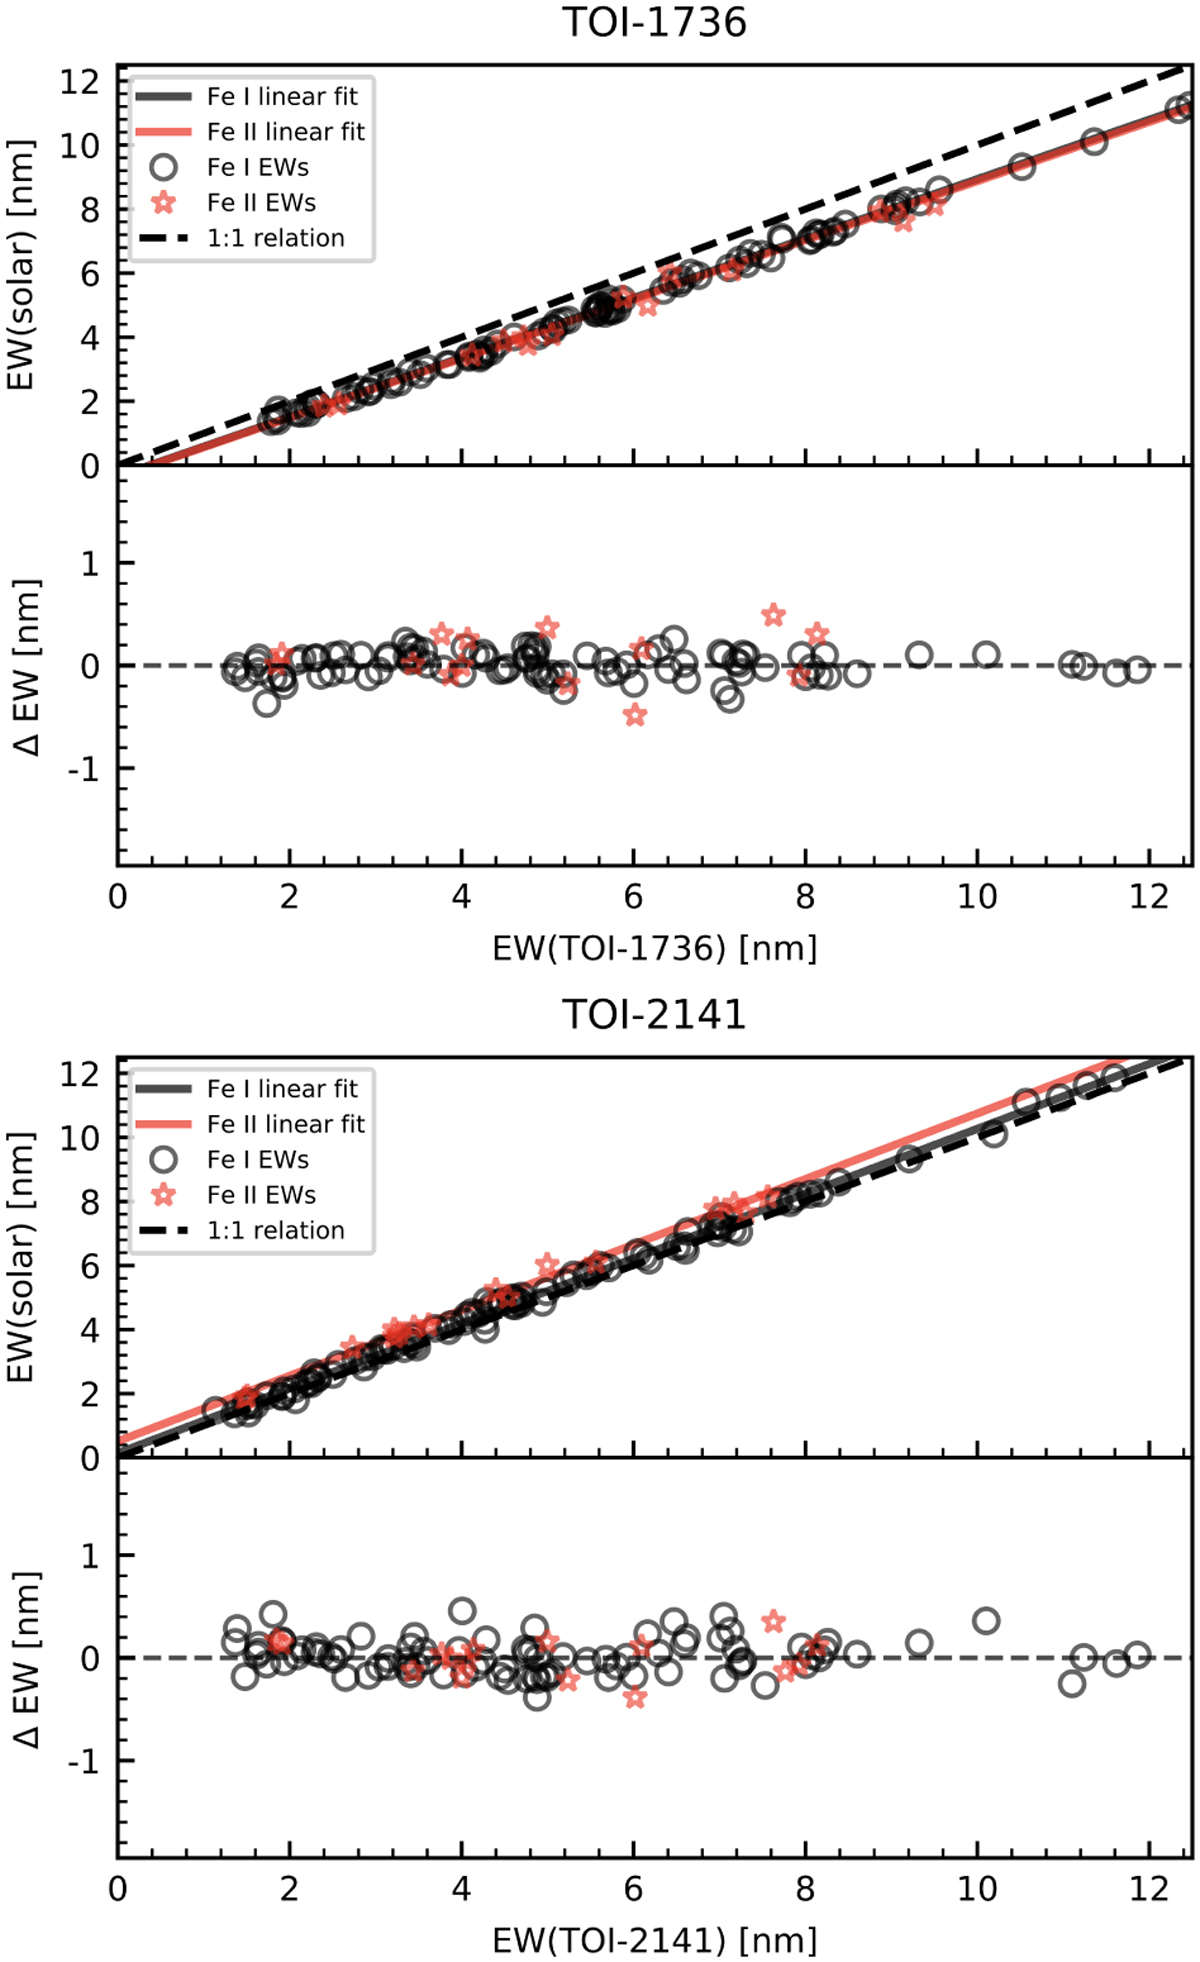
Comparison between solar and stellar EW measurements. TOI-1736 and TOI-2141 are shown in the top and bottom panels, respectively. The dashed black line is the 1:1 EWs ratio, and the solid black line is a linear fit based on the Fe I lines, represented by empty black circles. The red star symbols represent the Fe II lines, followed by their linear fit represented by the solid red line. The typical standard deviation of the average linear fit is around ~0.1–0.2 nm, which means ~2% in relative terms.
Current usage metrics show cumulative count of Article Views (full-text article views including HTML views, PDF and ePub downloads, according to the available data) and Abstracts Views on Vision4Press platform.
Data correspond to usage on the plateform after 2015. The current usage metrics is available 48-96 hours after online publication and is updated daily on week days.
Initial download of the metrics may take a while.