Fig. 3
Download original image
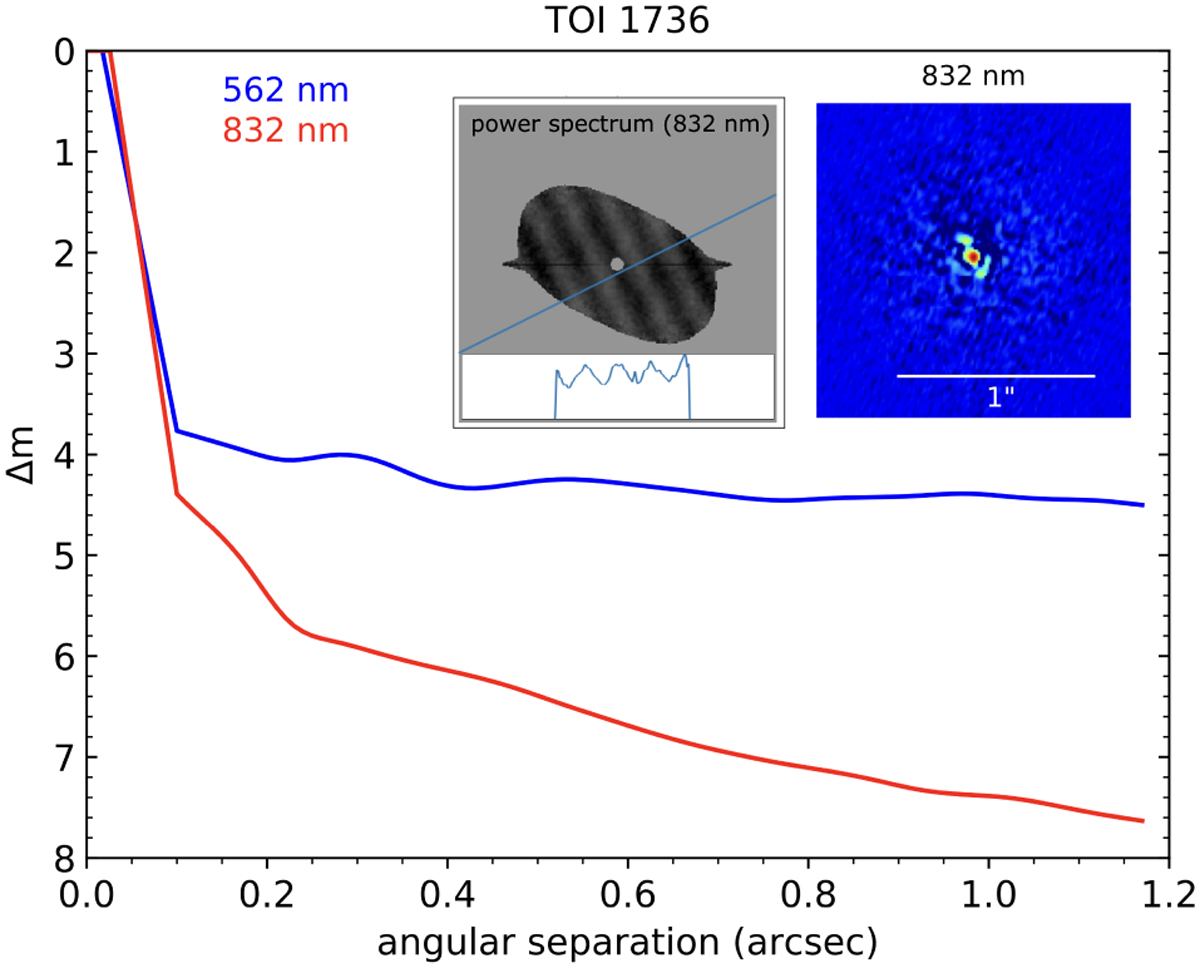
Contrast ratio of TOI-1736 as a function of angular separation at 562 nm (blue line) and at 832 nm (red line) obtained from the ‘Alopeke/Gemini speckle imaging observations. The small panels show the reconstructed speckle image (right subpanel) and its power spectrum in Fourier space (left subpanel). The power spectrum shows fringes that match a binary model.
Current usage metrics show cumulative count of Article Views (full-text article views including HTML views, PDF and ePub downloads, according to the available data) and Abstracts Views on Vision4Press platform.
Data correspond to usage on the plateform after 2015. The current usage metrics is available 48-96 hours after online publication and is updated daily on week days.
Initial download of the metrics may take a while.