Fig. 18
Download original image
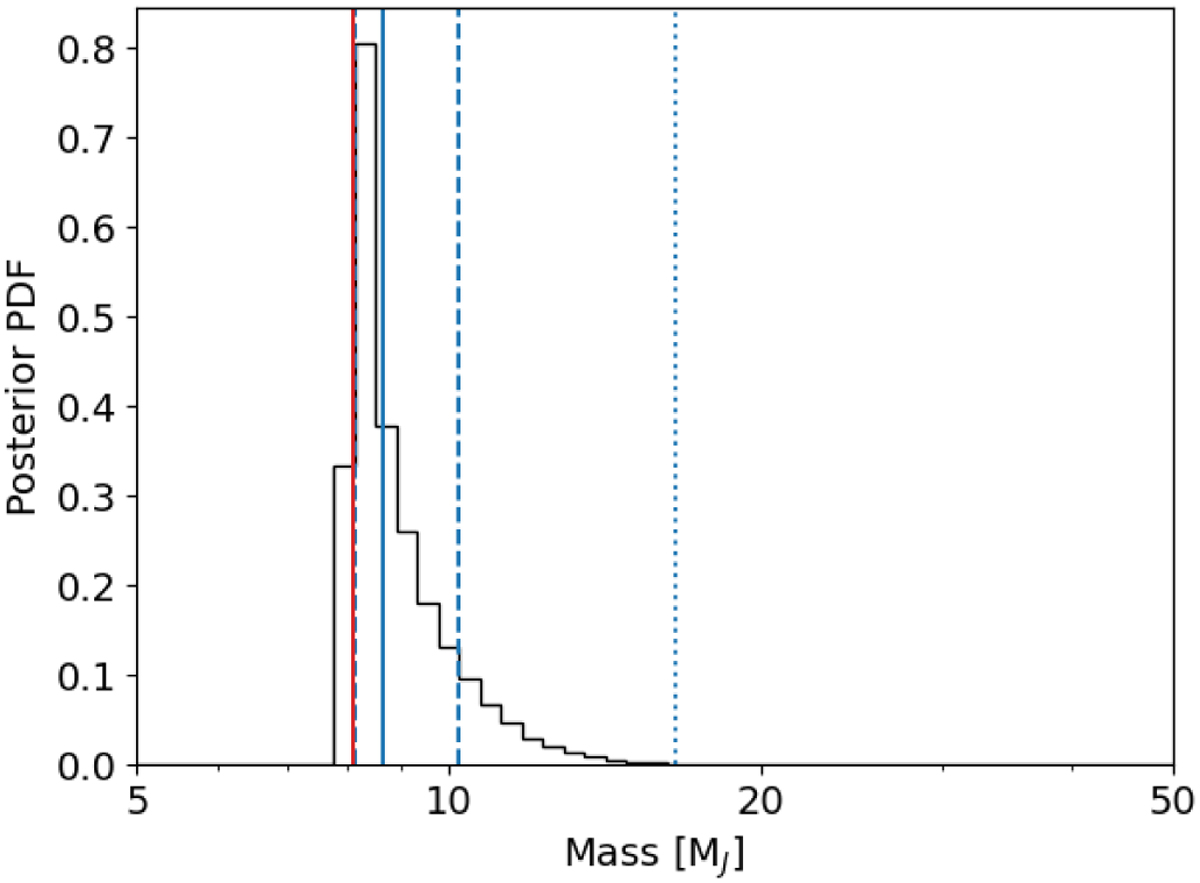
TOI-1736 c mass determination. The black line shows the mass posterior distribution obtained from RV-derived parameters and GAS-TON simulations of astrometric excess noise. The solid and dashed blue lines show the median and the ±1σ range of the distribution. The red line shows the minimum mass of Mp sin ip = 8.09 MJup obtained from our RV analysis and the dotted blue line shows the 3σ upper limit of <16.54 MJup.
Current usage metrics show cumulative count of Article Views (full-text article views including HTML views, PDF and ePub downloads, according to the available data) and Abstracts Views on Vision4Press platform.
Data correspond to usage on the plateform after 2015. The current usage metrics is available 48-96 hours after online publication and is updated daily on week days.
Initial download of the metrics may take a while.