Open Access
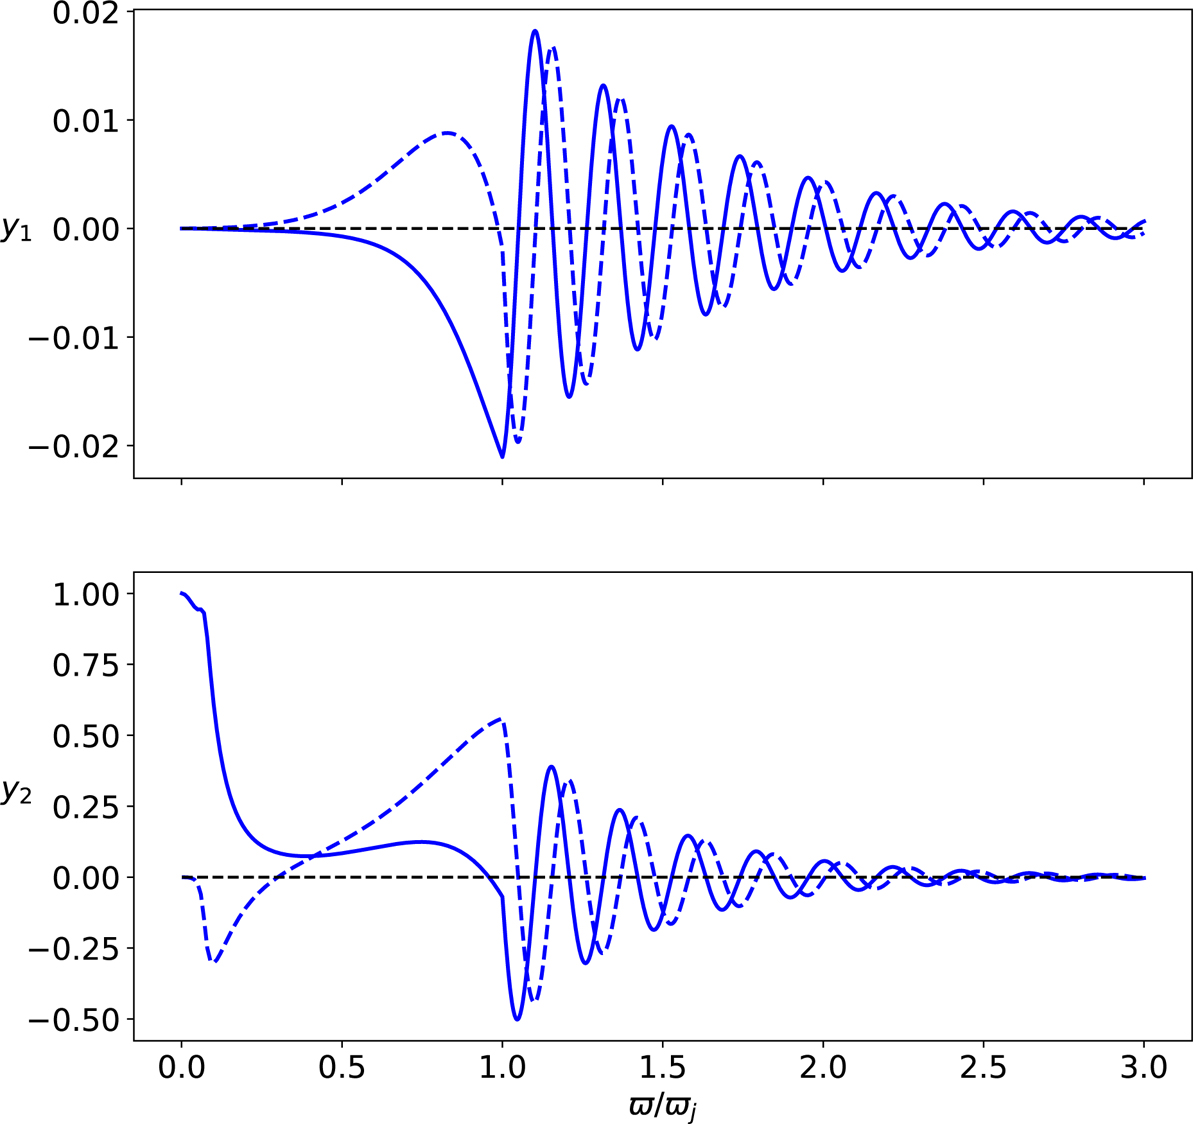
Fig. 22.
Download original image
Eigenfunctions for alternative configuration F5. The top and bottom plots correspond to y1 and y2, respectively. Solid and dashed lines represent the real and the imaginary part of the eigenfunctions.
Current usage metrics show cumulative count of Article Views (full-text article views including HTML views, PDF and ePub downloads, according to the available data) and Abstracts Views on Vision4Press platform.
Data correspond to usage on the plateform after 2015. The current usage metrics is available 48-96 hours after online publication and is updated daily on week days.
Initial download of the metrics may take a while.