Open Access
Fig. 2.
Download original image
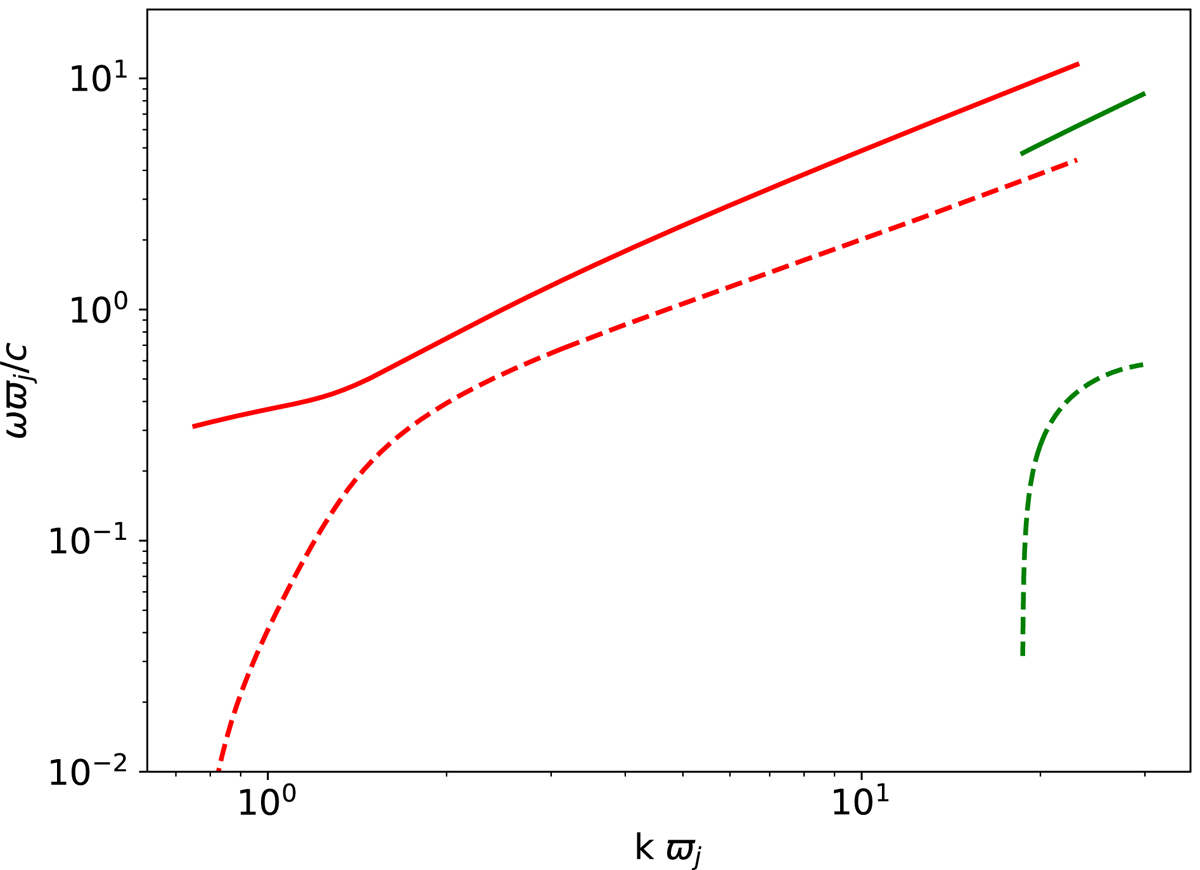
Dispersion relation plot for the KH mode (solution show in red). The solid line represents Re(ω) while the dashed line shows Im(ω). This dispersion plot corresponds to case F and the environment is hydrodynamic.
Current usage metrics show cumulative count of Article Views (full-text article views including HTML views, PDF and ePub downloads, according to the available data) and Abstracts Views on Vision4Press platform.
Data correspond to usage on the plateform after 2015. The current usage metrics is available 48-96 hours after online publication and is updated daily on week days.
Initial download of the metrics may take a while.