Fig. 9
Download original image
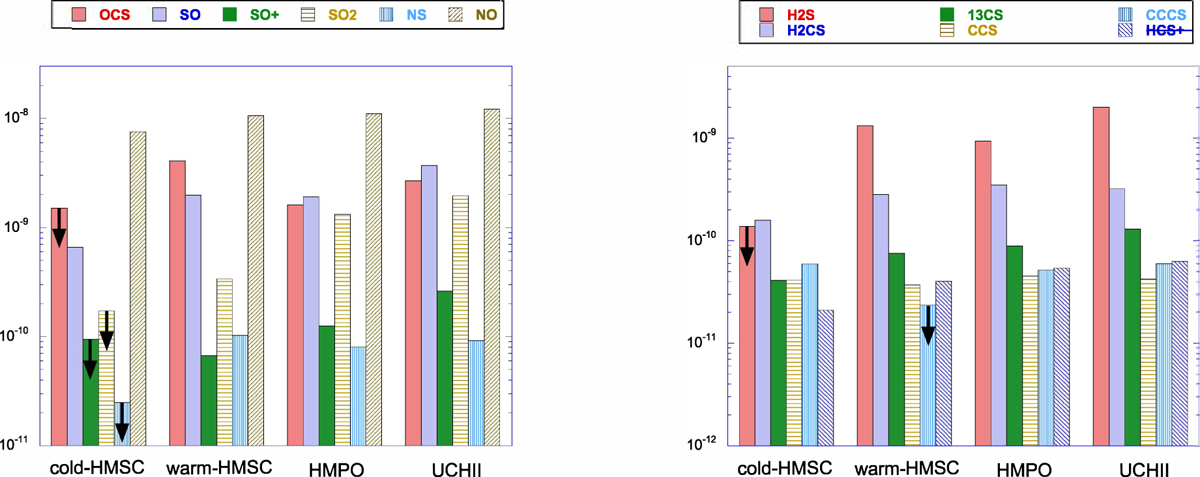
Mean fractional abundances as a function of the evolutionary stage. The down-pointing arrows indicate mean upper limits. Left panel: measured mean abundances of S-bearing species containing oxygen and/or nitrogen. The sources are ordered from left to right according to their evolutionary stage (from HMSCs to UCHIIs). Right panel: same as the left panel for S-bearing species containing only carbon and/or hydrogen.
Current usage metrics show cumulative count of Article Views (full-text article views including HTML views, PDF and ePub downloads, according to the available data) and Abstracts Views on Vision4Press platform.
Data correspond to usage on the plateform after 2015. The current usage metrics is available 48-96 hours after online publication and is updated daily on week days.
Initial download of the metrics may take a while.